Power, Institutions, and Labor-Market Inequality
Chapter 4 public working draft
Download the current dated PDF snapshot
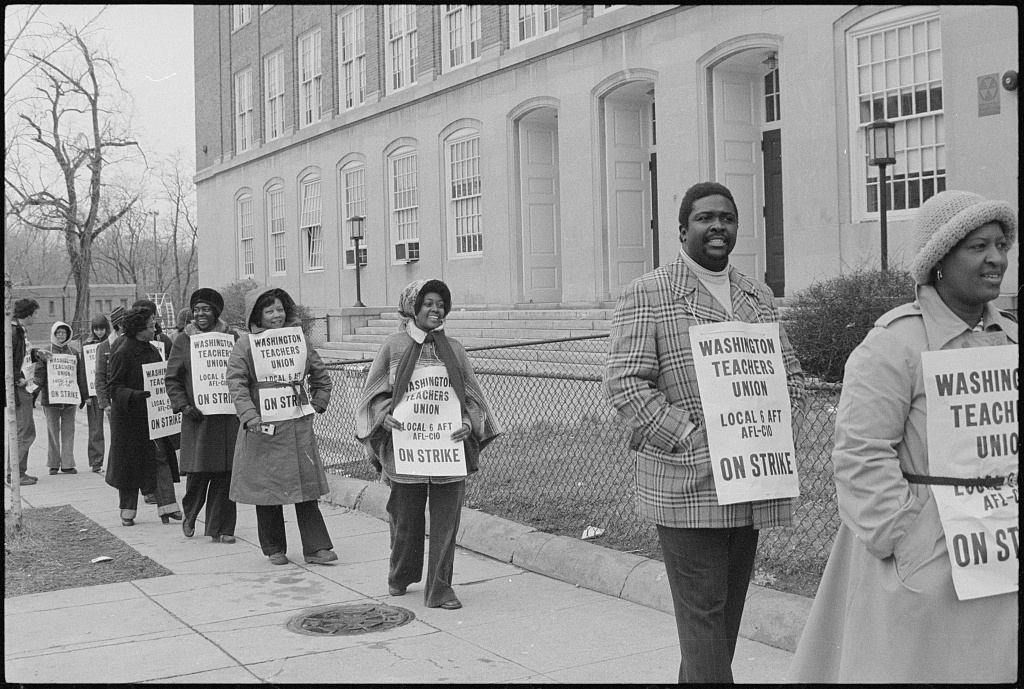
Public working draft. This chapter scaffold tests how the Chapter 2–3 model can organize power and inequality. Google Docs remains canonical. The UAW hook, empirical claims, institutional comparisons, group evidence, and Lorenz-curve decision all require coauthor and fact-check review.
Central question: How do bargaining power, unions, competition, and public rules change wages, employment, productivity, and the distribution of income?
By the end of this chapter, you should be able to: distinguish several measures of inequality; construct a segmented Lorenz curve from unemployment, wages, and profits; connect the WS–PS equilibrium to a whole-economy income distribution; distinguish a bargaining-only union effect from a productivity effect; trace product-market power through PS; and evaluate institutions for both distributional and efficiency effects.
4.1 The UAW strike and a changing balance of power
In September 2023, the United Auto Workers began a strike against Ford, General Motors, and Stellantis. Instead of calling every covered worker out at once, the union initially selected particular facilities and expanded the action over time. That strategy made a central feature of employment visible: an individual worker may have little power to interrupt production, but coordinated workers can change what actions are feasible for both sides. UAW and BLS sources
A labor union is an organization of workers that represents members in matters such as pay, hours, conditions, and workplace rules. Collective bargaining replaces many separate worker–employer negotiations with a negotiation between representatives. A strike is costly to workers who give up pay and to firms that lose production, sales, or customer relationships. The credible ability to impose those costs can affect the agreement even if a strike is avoided.
This is structural power: power that follows from a person’s or group’s position in an interdependent system. Workers at a production bottleneck may have more structural power than their number alone suggests. Bargaining power is the ability to obtain a more favorable agreement, shaped by patience, outside options, organization, information, law, norms, and each side’s ability to withstand disagreement.
The Rules of the game principle directs attention beyond personalities. US labor law, contract coverage, strike rules, employer strategy, benefit systems, and social norms shape which threats are credible and who bears the cost of delay.
The strike also occurred after a long decline in union membership. In 1983, about one in five US wage and salary workers belonged to a union. In 2023, when the UAW strike began, the share was one in ten. That national pattern does not tell us why membership changed, how union coverage differs from membership, or how much power a particular union has. It does show that the institutions through which workers bargain collectively have become less common.
Four related measures answer different questions. Keeping them separate prevents a common mistake: treating one percentage as a complete measure of worker power.
| Measure | What it records | What it cannot show by itself |
|---|---|---|
| Union membership | Wage and salary workers who report belonging to a union | Contract quality, strike capacity, or a causal wage effect |
| Union representation or coverage | Workers represented by a union or employee association, including some nonmembers | Whether representation is strong or the contract is enforced |
| Strike activity | Workers and days idle in recorded work stoppages; BLS’s major-stoppage measure has a size threshold | All labor conflict or bargaining that avoids a strike |
| Ratified contract terms | The formal wages, benefits, investments, and rules agreed by the parties | What would have happened without the strike or the agreement’s full long-run effects |
The UAW’s releases and ratified contracts are primary sources for what the union did and what the agreements say. They are participant sources, so evaluative claims about causes, costs, spillovers, or broader worker gains require independent evidence. The BLS membership series is an official survey estimate, but it is not a measure of the UAW alone.
Reading the opening evidence one step at a time
Moving right means moving forward in time. Moving up means a larger share of employed wage and salary workers belongs to a union. The denominator is not every adult and not every employed person; it excludes the self-employed and other workers outside the BLS wage-and-salary-worker definition.
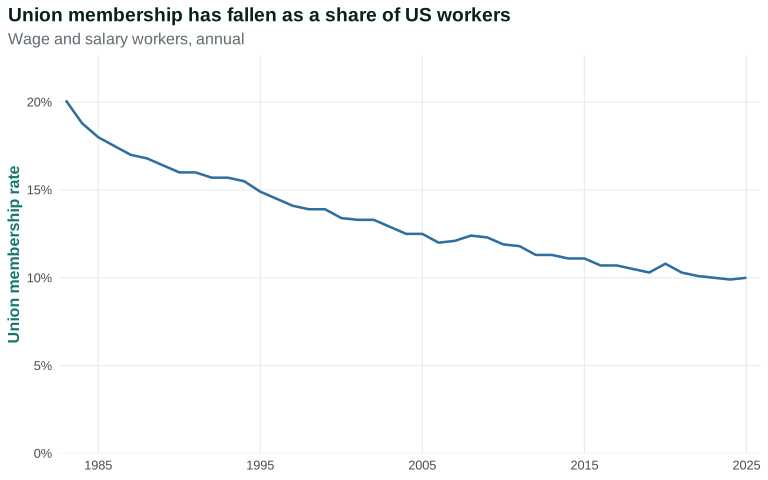
The broad pattern is decline, but the rate does not fall every year. A national average also combines very different public- and private-sector rates, industries, occupations, states, and demographic groups.
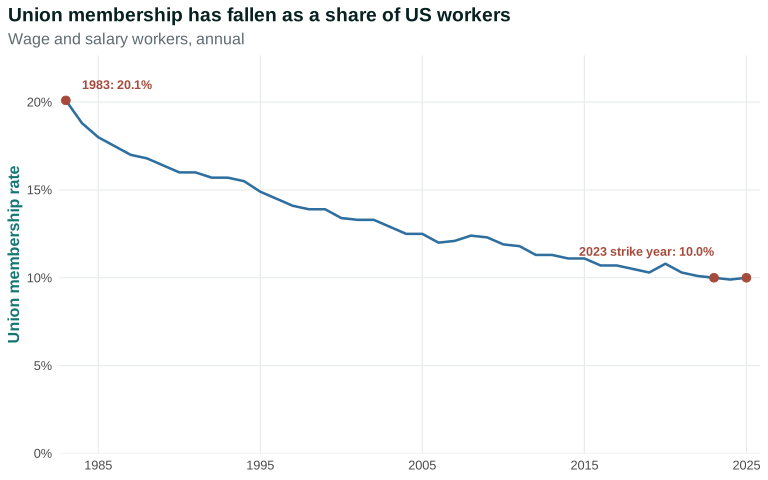
The 2023 point locates the UAW strike in time; it does not measure UAW membership, strike participation, or the strike’s effect. The 2025 estimate is based on eleven months because the October survey was not collected, so BLS warns that it is not strictly comparable with other annual averages.
Everyday Economics 4.1
One request or a coordinated request?
Compare asking a landlord, employer, or campus administration for a change alone with making the request as an organized group. What becomes possible, and what new costs or conflicts appear?
Fact-check flag: Verify the strike chronology and terminology against UAW releases, the ratified agreements, and BLS work-stoppage records. Verify the membership-series denominator and 2025 comparability warning. Any claim about causes, spillovers, or worker gains needs an independent source rather than a party’s press release alone.
Questions
Review the live step-by-step figure
Question 4.1. Which statement is supported by Figure 4.1?
- The decline in union membership proves that unions lost all bargaining power
- The union membership rate among wage and salary workers fell from 20.1% in 1983 to about 10% in the early 2020s
- The UAW strike caused the national membership rate to become 10%
- Ten percent of all US adults were UAW members in 2023
Exercise
Membership and power
Use Figure 4.1 to describe the change in union membership since 1983 and explain why the rate does not directly measure bargaining power. Then identify the workers, firms, customers, and public institutions in the UAW case; for each side, name an outside option, a cost of disagreement, and one source of structural or bargaining power.
The model solution is available in the restricted instructor materials.
4.2 From three economic classes to a Lorenz curve
Chapter 3 ended with a best-response equilibrium: the wage-setting and price-setting plans were mutually consistent at a real wage of 16 units and employment of 80 workers in the shared teaching model. The labor force contains 90 potential workers, so 10 are unemployed. Output per employed worker is 20 units. At the 25% markup convention used in Chapter 3, 16 units go to the worker as the real wage and 4 units remain as profit per employed worker.
Those numbers let us construct a whole-economy distribution rather than merely assume one. Add 10 firm owners to the 90-person labor force, producing a population of 100. Total output is \(80 \times 20 = 1{,}600\) units. Total wage income is \(80 \times 16 = 1{,}280\) units. Total profit is \(80 \times 4 = 320\) units. If profit is divided equally among 10 owners, each owner receives 32 units.
| Economic class | People | Market income per person | Total class income | Share of modeled market income |
|---|---|---|---|---|
| Unemployed people | 10 | 0 | 0 | 0% |
| Employed workers | 80 | 16 | 1,280 | 80% |
| Firm owners | 10 | 32 | 320 | 20% |
| Total | 100 | — | 1,600 | 100% |
The table is an accounting construction. It does not claim that the United States contains only three homogeneous groups. Its purpose is to show exactly how employment, the real wage, productivity, and profit determine the modeled distribution before we change an institution.
Before explaining inequality, specify what is unequal. Earnings are payments from work. Income can include earnings, self-employment income, property income, and transfers, depending on the dataset. Wealth is a stock of assets minus debts. A household can have modest current income but substantial wealth, or high earnings and negative net wealth.
Market income is income before taxes and government transfers under the chosen statistical definition. Disposable income is income available after direct taxes and transfers under that definition. Comparing the two can show how public policy changes the distribution, but definitions differ across sources and in-kind services are not always included.
An income share asks what fraction of total income goes to a group—for example, workers or owners. The Gini coefficient compresses the distribution into one number, usually from zero for complete equality to one for maximum inequality in the stylized limit. A single number is convenient, but it cannot show which class receives income or why. UOE Micro Ch. 5 and TE 2.0 §§2.2–2.3
To make the distribution visible, order the 100 people from lowest to highest market income. Ten unemployed people come first at zero. Eighty workers come next at 16 units each. Ten owners come last at 32 units each. These exact numbers are teaching assumptions, not estimates of the US economy. They let us see how employment, the wage share, and the profit share jointly determine a segmented Lorenz curve.
Constructing the segmented Lorenz curve one step at a time
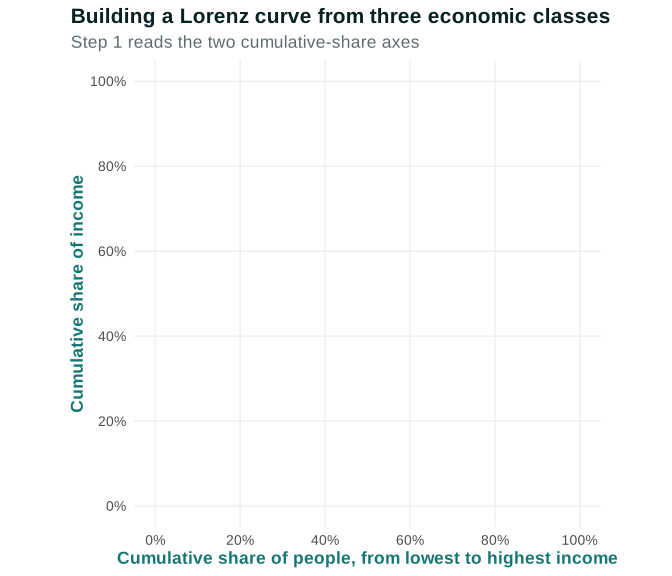
People are ordered from lowest to highest market income. At 40% on the horizontal axis, we have included the lowest-income 40 people. The vertical coordinate asks what share of all market income they receive.
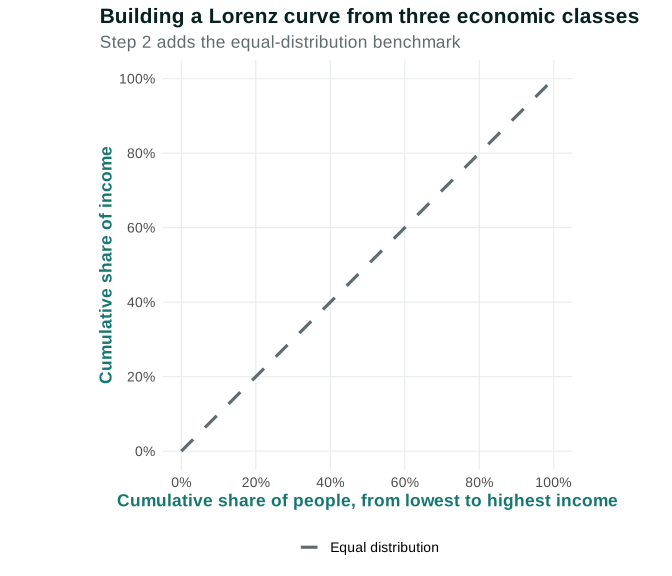
On this benchmark, the bottom 40 people receive 40% of income and the bottom 80 receive 80%. It is a reference line, not a prediction.
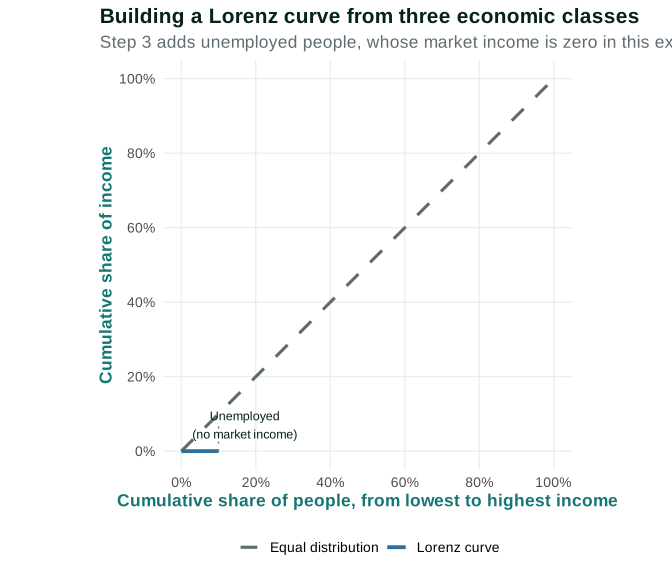
The first ten people have zero market income, so their cumulative income share remains zero. A longer flat segment would mean more unemployment, holding the other assumptions fixed.
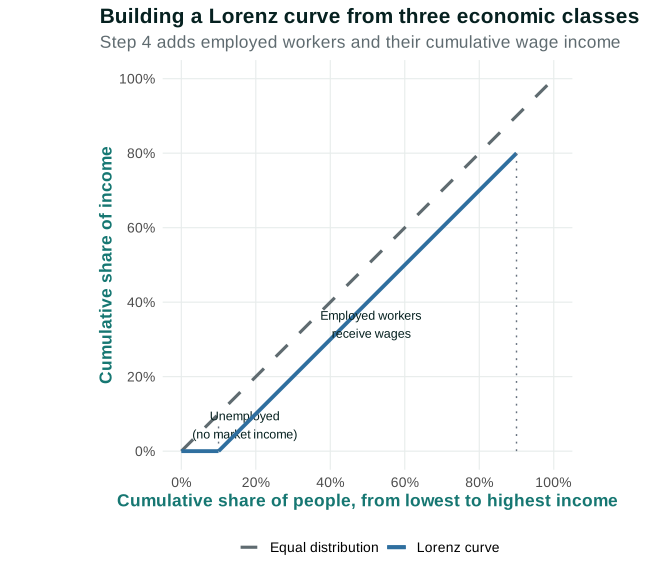
The next eighty people are employed at the same wage. Together they receive 80% of market income, so the curve reaches 80% of income after 90% of the population has been counted. If wages rise relative to profits, this segment ends higher.
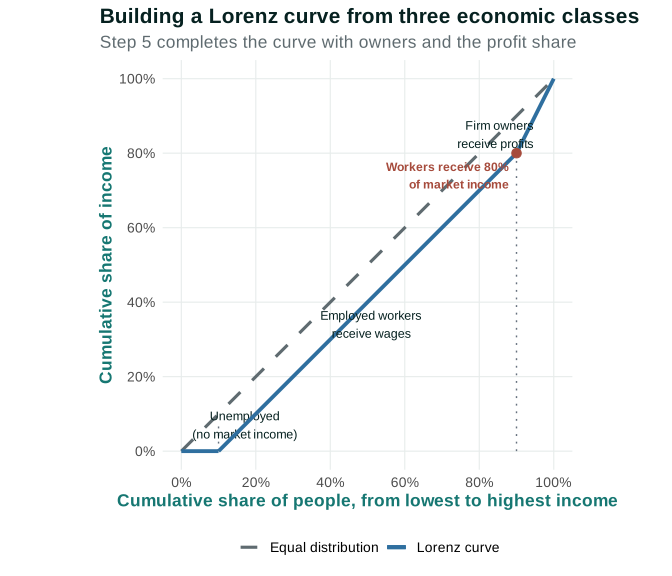
The final ten people receive the 20% profit share. Because each straight segment contains people with the same assumed income, its slope is that class’s income per person. The final segment is steepest because each owner receives more market income than each worker in this simplified economy.
The Gini summarizes the gap between this curve and the equality line. The full curve is more informative here: unemployment determines the length of the flat segment, the real wage helps determine the worker segment, and profits determine what remains for owners. Taxes, transfers, unequal wages within each class, household composition, and wealth are omitted.
Open the live step-by-step figure
The limitations should be read immediately, not saved as an afterthought. Many unemployed people receive unemployment insurance, family income, or property income. Workers differ in wages, hours, authority, and asset ownership. Owners may also work, and many workers hold retirement accounts containing shares. Households share income, taxes and transfers redistribute resources, public services provide benefits not recorded as cash income, and wealth can be far more unequal than annual income. The simplified classes identify positions in production and distribution; they do not exhaust the social structure of class.
Use the curve to make comparisons, not moral rankings
A Lorenz curve describes a distribution under a declared income concept. By itself it cannot tell us whether the distribution is just, whether total income is high, or whether anyone’s basic needs are met. Two economies can have the same Lorenz curve even if every person’s income is twice as high in one of them. They can also have crossing Lorenz curves, so that neither lies everywhere closer to equality. A judgment then requires more information than one summary ranking.
In this chapter, the curve is most useful as a mechanism map. If employment falls while the real wage and profit per worker are held fixed, the flat unemployed segment lengthens and fewer people receive wages. If productivity rises with the markup fixed, the real wage and profit per worker can both rise, but their shares remain fixed in this specific model. If the markup rises with productivity fixed, workers receive a smaller share and owners a larger one. Each comparison changes one condition so that we can see which breakpoint moves and why.
The ordering of people also deserves care. Our three-class example assumes every unemployed person’s market income is below every worker’s and every worker’s income is below every owner’s. Once transfers, unequal wages, small-business losses, or asset income are admitted, that ordering may change. An empirical Lorenz curve must sort the actual income unit—person, household, or tax unit—rather than impose class segments. The stylized curve teaches the connection from production to distribution; it is not a substitute for the empirical distribution.
Math Extension 4.2: From the Lorenz curve to a Gini coefficient
The Gini coefficient summarizes the area between the Lorenz curve and the equal-distribution line as a number between zero and one under the usual normalization. A larger value indicates that the Lorenz curve lies farther from equal distribution. The number is useful for compact comparisons, but two economies can have the same Gini while differing in unemployment, wage dispersion, ownership, taxes, or the incomes of the very top and bottom. For this chapter, the segmented curve remains the main analytical tool because it preserves the connection to economic classes and mechanisms.
Model-review flag: Figure 4.2 is a teaching model, not US data. Review whether zero income for unemployed people, equal wages within the worker class, equal profits within the owner class, and a ten-person owner class are the most useful starting assumptions. Later versions should compare the model with empirical distributions without presenting the assumptions as observations.
Questions
Review the live step-by-step figure
Question 4.2. In the three-class Lorenz model, why is the first segment flat?
- The unemployed group receives no market income in the model
- All workers receive the same wage
- Firm owners receive profits
- The Gini coefficient is zero
Exercise
Build the three-class Lorenz curve
Use Figure 4.2. In a population of 100, suppose 10 people are unemployed with no market income, 80 employed workers receive 80% of market income in equal shares, and 10 owners receive the rest in equal shares. Write the four Lorenz coordinates, explain the slope of each segment, and predict how the curve changes if five unemployed people become employed at the same wage.
The model solution is available in the restricted instructor materials.
4.3 Unions change the labor-market game
Before adding a union, place the Section 4.2 calculation beside the Chapter 3 diagram. The whole-economy model combines two diagrams: WS–PS determines employment and the real wage; those outcomes determine how many people occupy the unemployed and worker segments of the Lorenz curve, while PS and the markup help determine the division between wages and profits. TE 2.0 §2.9 and BFH figure source
From the best-response equilibrium to a whole-economy distribution
The left panel is the labor-market model. Moving right means more employment; moving up means a higher real wage. The right panel is the distributional model. Moving right adds people ordered by market income; moving up adds their cumulative income.
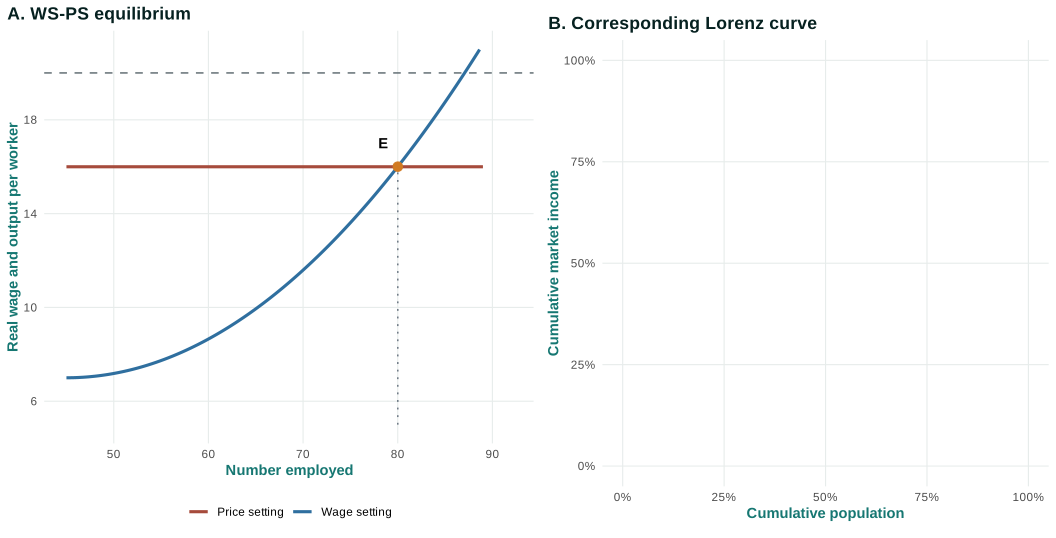
The intersection at \(E\) determines how many potential workers are employed and the real wage they receive. People to the right of the equilibrium employment level are unemployed in this simplified model.
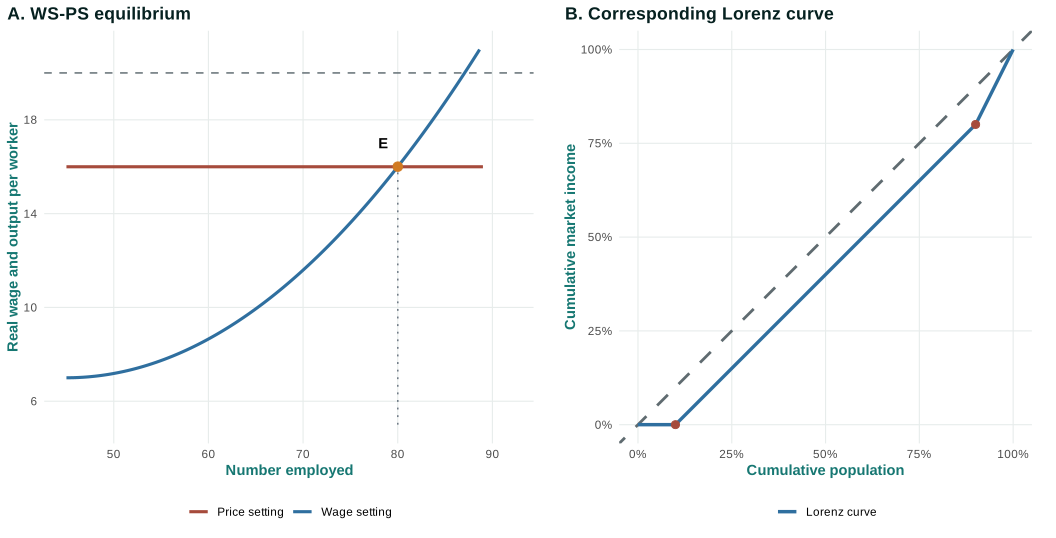
The unemployment implied by \(E\) becomes the flat opening segment of the Lorenz curve. The wage and employment level help determine workers’ total income share. Owners receive the remaining profit share.
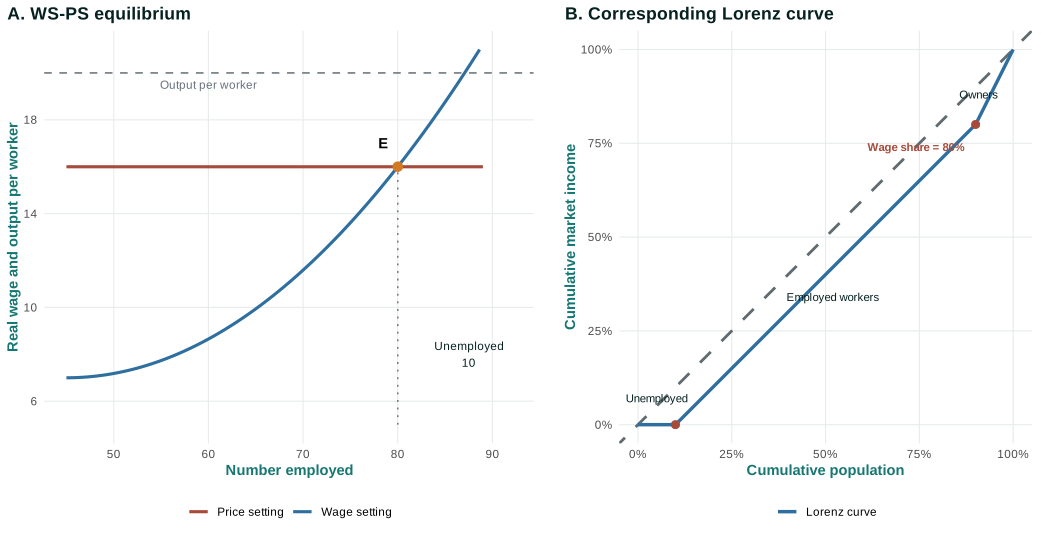
The arrows are conceptual, not an additional equation. A change in WS or PS can alter employment, wages, the wage share, the profit share, and therefore the shape of the Lorenz curve. This is why a labor-market institution may affect both efficiency and distribution.
Open the live step-by-step figure
Chapters 2 and 3 treated the firm as offering a feasible wage to an individual worker. Collective bargaining adds an organized actor. Workers may negotiate not only over the wage but also scheduling, safety, staffing, benefits, promotion, discipline, training, and how workplace change occurs. TE 2.0 §2.5
The simplest model says that bargaining power can raise the wage workers seek at a given employment level. But representing a union as only an upward WS shift is incomplete. At least four channels may operate:
| Channel | Possible effect | Question to investigate |
|---|---|---|
| Bargaining | More of the gains from cooperation go to workers | How does the agreement change wages and employment? |
| Voice | Workers can report problems and influence decisions | Does voice reduce quits or improve job satisfaction? |
| Cooperation | Repeated negotiation can solve production problems | Does productivity or quality change? |
| Conflict | Strikes and resistance interrupt production | Who bears the short- and long-run costs? |
This is the Principle of gains from cooperation and conflict of interest. Employment can create gains for workers and owners while leaving conflict over how those gains are divided and how the workplace is governed.
Union coverage may also affect nonunion workers. Employers can raise pay to deter organizing, union standards can become industry reference points, or unionized firms can lose business to competitors. The sign and size of spillovers are empirical questions.
Bargaining power depends on the cost of waiting. A worker with a strike fund, savings, family support, or access to public benefits can withstand lost pay longer. A firm with inventories, alternative plants, access to credit, or the ability to shift production can withstand lost output longer. Suppliers, dealers, customers, and communities can also bear costs even though they are not sitting at the bargaining table. The final agreement therefore reflects ownership, finance, institutions, and interdependence as well as preferences.
Law changes the feasible strategies. Rules about union recognition, protected concerted activity, replacement workers, contract enforcement, and bargaining subjects influence whether workers can coordinate and whether employers can delay, relocate, or dismiss. We do not treat “the union” or “the firm” as single-minded actors: members may disagree about priorities, managers and shareholders may have different time horizons, and elected leaders face internal governance. Organization creates power, but it also creates decision problems within each side.
Separate a bargaining effect from a productivity effect
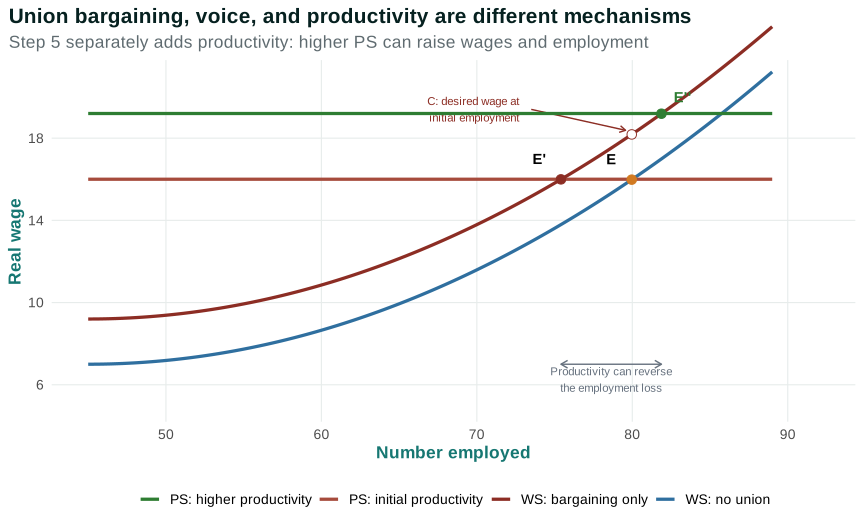
The diagram below deliberately separates three cases that are often combined in verbal arguments. If collective bargaining only raises the wage workers seek at each employment level, WS shifts upward while PS stays fixed. At the initial employment level, point \(C\) is the negotiated wage workers seek, but that wage is above the firm’s feasible price-setting wage. The new intersection \(E'\) has lower employment—therefore higher unemployment. Because PS is horizontal and unchanged, the equilibrium real wage remains at the PS level. The higher value at \(C\) is the desired wage at the old employment level, not the feasible equilibrium wage. Saying that the equilibrium wage rises, or that a wage-only WS shift reduces unemployment, would reverse or misread the model’s logic.
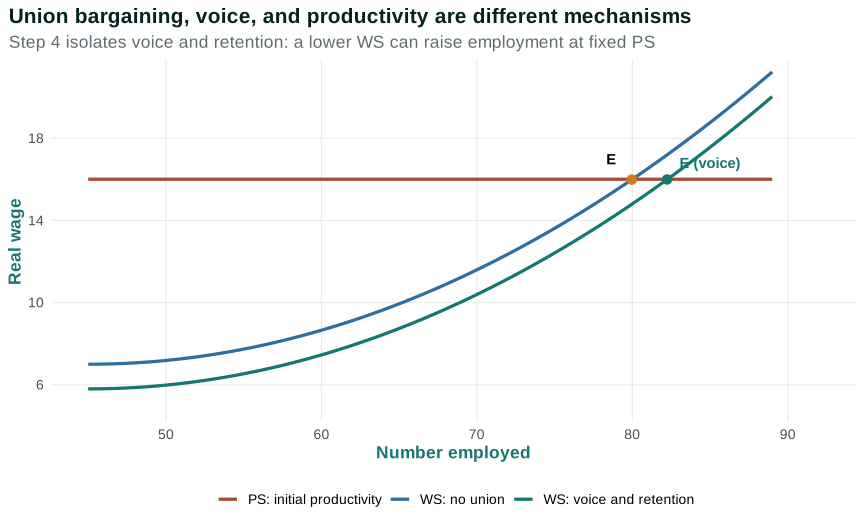
A second possibility is a voice and retention effect. Workers may identify safety or production problems, turnover may fall, and workplace rules may become more predictable. If those changes reduce the wage needed to sustain retention and effective work at each employment level, WS shifts downward and employment can rise at fixed PS. This is not guaranteed; it is a distinct hypothesis.
A third possibility is that collective voice, cooperation, lower turnover, or training raises productivity. PS then rises. In the stylized final step, this productivity effect is large enough to raise both the real wage and employment. Whether actual unions generate any of these effects, and how large each is, requires evidence.
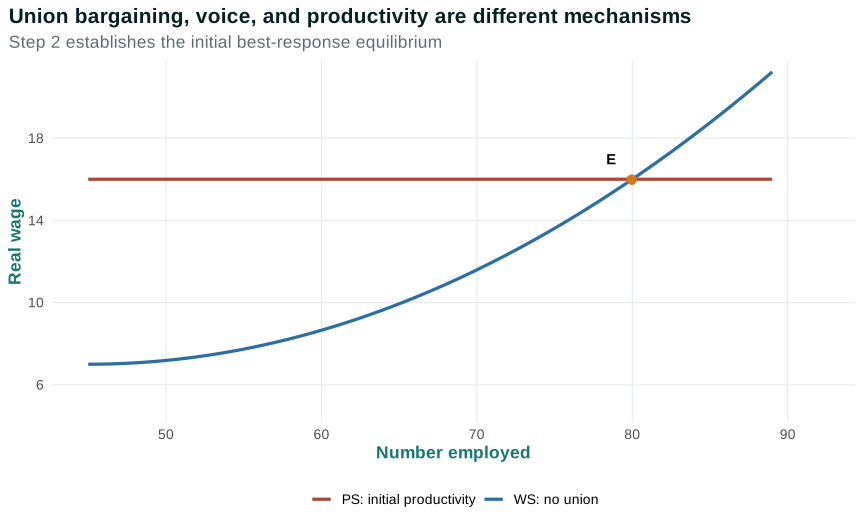
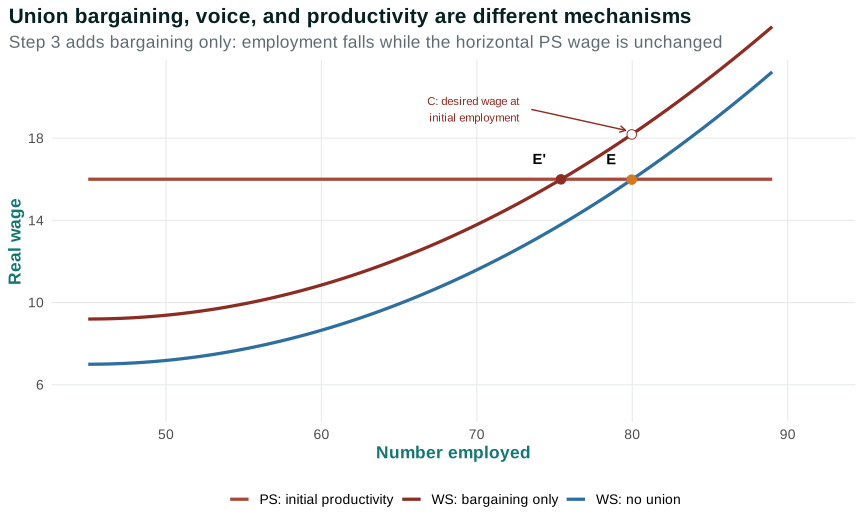
Open the live step-by-step figure
The three cases change the income table differently. Bargaining only increases unemployment in the model but leaves the wage per employed worker at 16. A pure voice effect can increase the number of workers receiving that wage. A productivity effect raises output per worker and the feasible real wage, enlarging the total available for wages and profits. A complete empirical analysis must therefore measure more than a union wage difference: it needs employment, hours, turnover, productivity, prices, profits, and the terms of the agreement.
Build from UOE Micro
The Chapter 8 working draft develops feasible choices and doing the best you can. UOE Micro then shows how a union changes the individual-worker employment game, strengthens the worker’s outside option, and connects union power to inequality and wage setting. This chapter moves from those individual interactions to aggregate employment and distribution.
Everyday Economics 4.2
Voice or exit?
When a schedule or workplace rule is unfair, a worker can leave, complain individually, or act with coworkers. Which option is feasible depends on savings, alternative jobs, legal protection, and relationships at work.
Questions
Review the live step-by-step figure
Question 4.3. Holding a horizontal PS curve fixed, what does an upward bargaining-only shift in WS do in Figure 4.4?
- It raises employment and lowers the real wage
- It lowers employment while the equilibrium real wage remains at the PS level
- It leaves employment and the real wage unchanged
- It shifts PS upward automatically
Exercise
Bargaining
Use Figure 4.4. First hold horizontal PS fixed and trace the bargaining-only WS shift from E to E’. Explain why employment falls while the equilibrium real wage remains at the PS level. Then analyze the separate voice and productivity states. State how each case changes employment, total wages, profits, and the Lorenz segments, and name evidence that could distinguish the mechanisms.
The model solution is available in the restricted instructor materials.
4.4 Competition, markups, monopsony, and the labor share
Power also appears when firms interact with customers and workers. Product-market power can allow a firm to sustain a larger markup. In the Chapter 3 diagram, a larger markup lowers the price-setting real wage for given productivity. Labor-market power can let employers offer less favorable wages or conditions when workers have few credible alternatives.
Monopsony power is employer power arising when workers’ labor supply to a firm is not perfectly responsive to the wage and conditions it offers. Search costs, commuting distance, occupation-specific skills, caregiving, health insurance, licensing, discrimination, and agreements among employers can all limit alternatives.
Product-market and labor-market power can coexist, but they answer different questions. Product-market power concerns how customers respond to the firm’s price relative to alternatives. Monopsony concerns how workers respond to the firm’s wage and conditions relative to other jobs or nonemployment. A hospital may face little competition in a local patient market and also be the dominant employer of specialized nurses. A national retailer may face intense competition for customers while possessing local wage-setting power where workers have few nearby alternatives. Counting firms is not enough to measure either form of power.
Monopsony also changes how we should reason about a wage floor. In a model where an employer can hold wages below workers’ contribution because recruiting is gradual and quits respond imperfectly, a moderate minimum wage can raise both wages and employment by moving the firm toward a higher-recruitment point. At a sufficiently high level, the constraint can reduce employment. This conditional result is different from the bargaining-only WS shift in the whole-economy diagram. The assumptions, actors, and adjustment channel must be stated before borrowing a conclusion from one model for another.
The labor share is the share of income or output paid as labor compensation under a stated accounting definition. A lower labor share can be consistent with a wider gap between productivity and typical compensation, but it does not identify a single cause. Changes in technology, industry composition, globalization, measurement, rents, markups, and bargaining can overlap. TE 2.0 §2.9 and UOE Micro Chs. 13–14
Concentration is not identical to market power. A market with few firms may remain contestable; a market with many nominal employers may still give workers few practical alternatives. Markups, concentration, profits, labor shares, and wage-setting estimates are different measurements. Evidence is strongest when several measures support the same mechanism.
The labor share is an accounting ratio, not a welfare measure. A rising labor share could reflect stronger wages, but it could also occur during a recession if profits fall faster than compensation. An unchanged labor share can coexist with widening wage inequality if high-paid workers receive more while low-paid workers receive less. And compensation includes employer-paid benefits, which may not provide the same immediate security as cash wages. Distributional analysis therefore needs both the wage/profit division and the distribution within each class.
Lower competition in the whole-economy model
Suppose weaker product-market competition allows firms to charge a larger markup. With productivity unchanged, the real wage compatible with firms’ price-setting decisions falls, so PS shifts downward. The new best-response equilibrium has a lower real wage and lower employment. In the segmented Lorenz curve, the unemployed group grows, workers receive a smaller income share, and owners receive a larger profit share.
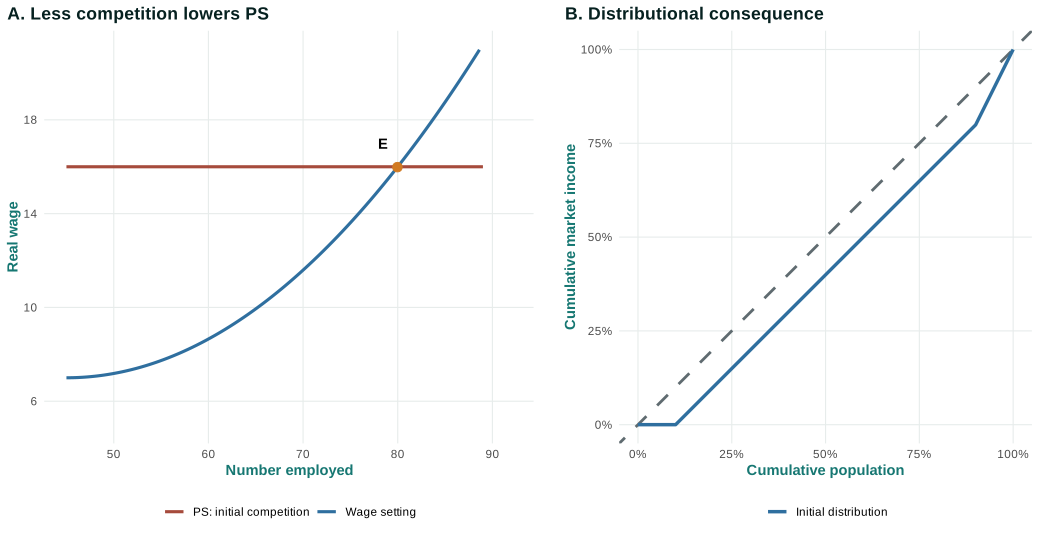
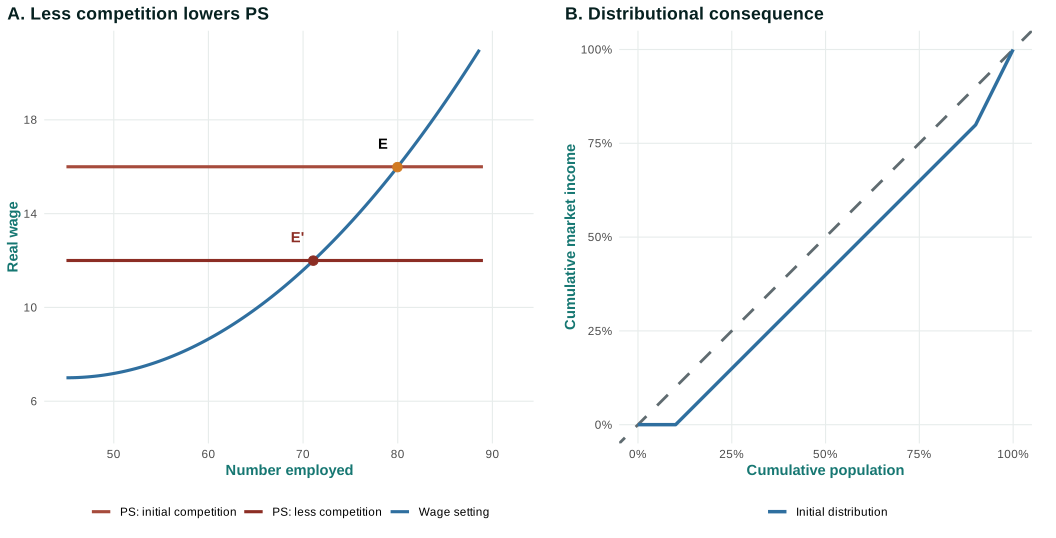
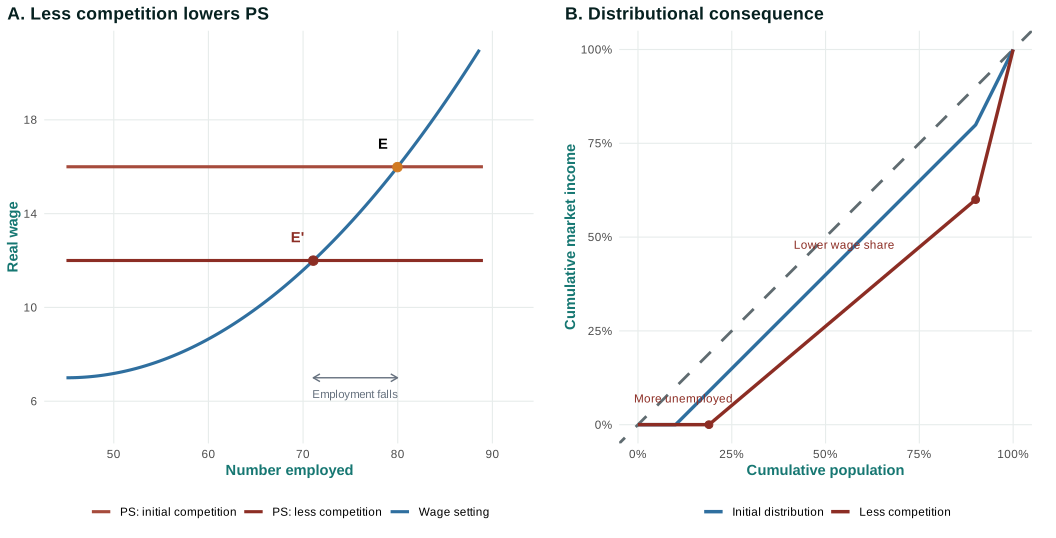
The figure shows a mechanism, not evidence that one historical change caused another. An empirical argument would need measures of competition or markups, productivity, employment, wages, and labor shares that are comparable over time.
Questions
Review the live step-by-step figure
Question 4.4. In Figure 4.5, how does a larger markup affect the whole-economy model when productivity is unchanged?
- PS shifts up and the worker share rises
- PS shifts down, employment and wages fall, and the owner share rises
- WS shifts down while PS is unchanged
- Only the Lorenz curve changes
Exercise
Competition and the whole economy
Use Figure 4.5 to trace a larger markup from PS to employment, the real wage, the wage share, and the three Lorenz segments. Then explain why a time series showing concentration and inequality rising together would not by itself establish this mechanism.
The model solution is available in the restricted instructor materials.
4.5 Institutions can change efficiency and distribution together
A labor-market institution is a formal or informal rule shaping employment relationships and labor-market outcomes. Minimum wages, unemployment insurance, collective bargaining, employment protection, training systems, scheduling laws, health insurance, and antidiscrimination enforcement are not interchangeable “interventions.” Each changes a package of incentives, insurance, power, and constraints.
| Institution | Outside option or bargaining channel | Possible productivity or employment channel |
|---|---|---|
| Unemployment insurance | Makes job loss less costly and permits longer search | Can improve matches; financing and search responses matter |
| Minimum wage | Sets a wage floor and may strengthen worker fallback | Effects depend on employer power, demand, compliance, and productivity |
| Employment protection | Changes dismissal costs and job security | Can encourage firm-specific investment or reduce some hiring |
| Training institutions | Expand skills and worker alternatives | Can raise productivity and ease recruitment constraints |
| Collective bargaining | Coordinates wage and workplace rules | Can produce voice, cooperation, conflict, or restraint |
The table rejects a one-dimensional ranking from “flexible” to “rigid.” An institution can shift wage setting, change price setting through productivity, alter matching, redistribute risk, and affect aggregate demand. The Principle of individual and societal interests asks whether individually sensible choices produce the outcome society values—and whether a changed rule can improve some goals while worsening others.
Fairness and efficiency are not always opposing objectives. More secure workers may invest in skills and share information; badly designed protection may make some firms reluctant to hire. Better insurance may improve job matching; it also changes search incentives and requires funding. The empirical task is to identify the relevant channels rather than attach one label to the entire package.
Evaluate a rule through a channel map
Take unemployment insurance. The direct insurance channel replaces part of lost earnings, so unemployment risk is shared through a public system rather than borne entirely by the displaced worker and household. The outside-option channel makes job loss less immediately damaging and may allow a worker to reject a poor match. The search channel can lengthen search for some people while improving the eventual match for others. Financing can affect firms and workers through payroll taxes. Spending by recipients can also support demand during a downturn, a feedback we study in Chapter 6. “Insurance raises unemployment” or “insurance improves matching” each names only one possible channel.
Now take training. A publicly supported apprenticeship can raise productivity, strengthen a worker’s outside option, reduce a firm’s recruitment problem, and create a transferable credential. Who pays, who controls entry, whether the credential travels across employers, and whether workers can leave after training all affect the division of gains. The same program can move WS and PS through different mechanisms.
Minimum wages, scheduling rules, employment protection, and antidiscrimination enforcement likewise have designs and enforcement conditions. A statutory right that workers cannot safely claim may have little effect. A rule can protect people already employed while changing firms’ willingness to create some jobs. Enforcement resources, immigration status, disability accommodation, legal representation, and worker organization determine whether formal rights become effective options.
The appropriate question is therefore not whether an institution is simply “rigid” or “flexible.” Ask whose feasible choices change, which risk is insured or shifted, which behavior responds, whether productivity changes, how firms adjust prices or hiring, and which evidence could measure each link.
For any proposed rule, use the same six-part audit:
- Name the actor and action. Who must, may, or can no longer do what?
- Identify the immediate constraint or outside option. Does the rule change pay, the cost of job loss, information, enforcement, or the ability to coordinate?
- Trace firm and worker responses. Consider hiring, search, effort, quits, training, prices, technology, and compliance rather than assuming only one margin changes.
- Follow the aggregate feedback. Many individually reasonable responses can change employment, spending, tax revenue, or the price level.
- Locate the distribution of gains and risks. Distinguish employed workers, jobseekers, owners, consumers, taxpayers, and groups with different access to the rule.
- State the evidence needed. A descriptive before-and-after pattern rarely identifies the rule’s effect if other conditions changed at the same time.
This audit does not guarantee one answer. It prevents the analysis from ending with a slogan. Two people can agree that an institution changes an outside option yet disagree about the size of its hiring response, its productivity effect, or the value placed on insurance. Those disagreements can then be connected to evidence and values rather than hidden inside a label.
Questions
Question 4.5. Why should labor-market institutions be assessed as packages of channels?
- Every institution has the same effect
- They can affect incentives, insurance, power, matching, productivity, and employment together
- Only distribution matters
- Only employment matters
Exercise
Evaluate an institutional package
Choose unemployment insurance, a minimum wage, employment protection, training, or collective bargaining. Trace its first effects on outside options, incentives, risk, productivity, and employment; identify at least one ambiguity.
The model solution is available in the restricted instructor materials.
4.6 Data Extension: Inequality across groups and places
Group averages can reveal persistent inequality by race, ethnicity, gender, education, disability, place, or other dimensions. They cannot establish that the group label itself causes the outcome. Explanations may involve occupation and industry sorting, networks, discrimination, caregiving, health, wealth, schooling, union coverage, local demand, transport, housing, and institutions. UOE Micro Chs. 5 and 10
Class must be an explicit part of this analysis, not a residual category represented only by “education.” Economic class concerns a person’s position in production and distribution: whether they depend mainly on wages, own income-producing assets, exercise authority at work, face unemployment risk, and can draw on wealth, credentials, organizations, or family resources. These dimensions overlap with race and gender but are not reducible to them. A Black nurse and a Black hospital executive may face some shared forms of racism while having very different workplace authority, wealth, job security, and outside options. The same is true across gender and within every other broad group.
A class-aware account therefore needs more than income quintiles. It should examine at least four mechanisms:
- Ownership and authority: Who owns productive assets, and who can direct other people’s work?
- Market dependence and risk: Who must sell labor to meet basic needs, and who can withstand unemployment, illness, or a strike?
- Institutions and collective organization: Who has access to unions, professional networks, schools, credit, legal representation, and political voice?
- Intergenerational transmission: How do wealth, neighborhoods, expectations, credentials, care responsibilities, and social connections shape children’s feasible options?
The WS–PS and segmented Lorenz model captures only part of this structure: unemployed people, wage earners, and owners occupy different positions in production and receive different forms of income. Its virtue is to make class visible. Its limitation is that it initially treats every worker and every owner as alike. Empirical work must then show inequality within those classes and the intersections among class, race, gender, place, and other institutions.
Place can alter class position without changing a person’s occupation label. A worker in a region with several employers, reliable transportation, affordable housing, and accessible childcare may have credible alternatives. A similar worker in a company town, a high-rent city, or an area without public transit may not. Disability access, licensing, language, citizenship, and discrimination can narrow the set of jobs that are genuinely feasible. Those constraints affect bargaining power and unemployment risk; they are not merely demographic characteristics added after the economic mechanism.
Wealth creates another divide within the same current income. A worker with savings or family wealth can survive a strike, relocate, pay for training, or wait for a better offer. A worker with debt and no buffer may accept unsafe conditions or an unpredictable schedule. An owner with diversified assets can bear a temporary loss differently from a small business owner whose household wealth is tied to one firm. Class analysis therefore combines income source with ownership, authority, risk, and resources over time.
Data Extension 4.6: Unions, class, and inequality
Begin with two BLS CPS comparisons: the share of wage and salary workers who are union members or represented by a union, and median usual weekly earnings for union and nonunion workers. State whether the table covers full-time wage and salary workers, whether it reports members or represented workers, the year, and the limits of the sample.
The raw earnings difference is descriptive. Union and nonunion workers differ in occupation, industry, public/private sector, education, experience, region, hours, and other characteristics. Workers also select into jobs, and employers select which jobs to organize, close, expand, or relocate. The raw gap therefore is not the causal effect of union membership.
Next compare the descriptive table with a coauthor-approved research result that addresses composition or selection directly. Farber, Herbst, Kuziemko, and Naidu’s long-run US study is a strong starting point because it connects changes in unionization to wage and income inequality using several datasets and empirical strategies. The exact published specification, population, period, and uncertainty must be checked before a result is graphed or summarized.
Use the two layers to answer five questions:
- What is the raw difference, and which population does it describe?
- Which worker, job, firm, sector, and place differences could contribute to it?
- What comparison or research design does the study use to move beyond the raw gap?
- Does the reported result concern hourly wages, weekly earnings, hours, wage dispersion, or household income?
- What remains unknown about employment, productivity, firm survival, spillovers, and nonwage conditions?
Class is visible here through wage dependence, union status, sector, workplace authority, and exposure to job loss. If the data are divided by race, gender, or place, interpret those patterns as intersections with institutions and class positions—not as rival explanations that make class disappear.
The extension is intentionally collapsed until a student chooses to open it. Its question block appears immediately afterward, following the UOE pattern.
The evidence does not replace the analytical model. It checks whether the mechanisms are plausible in particular populations and periods. A study may find that unionization compresses wages among covered workers while leaving open the effect on employment, firm entry, nonunion wages, or productivity. Another may find wage gains concentrated in particular sectors or groups. The right conclusion is conditional: institutions act through designs and contexts, and “the union effect” is not one universal parameter.
Data-development flag: Do not publish a group comparison until categories, denominators, sampling error, terminology, and disclosure risks have been reviewed. Avoid treating a descriptive gap as proof of discrimination or of any single mechanism. The final selection must show class directly and must not frame class, race, and gender as rival explanations when institutions can produce intersecting inequalities.
Questions
Question 4.6. Which comparison treats economic class as more than another name for education?
- Comparing college and noncollege average wages only
- Comparing workers by wage dependence, workplace authority, wealth, and unemployment risk
- Replacing every race category with an income quintile
- Using a national Gini coefficient without identifying income sources
Exercise
Class is more than an education category
Design a comparison using one US labor-market outcome and at least one direct class dimension: earnings source, wealth, occupation, workplace authority, union status, or exposure to unemployment risk. Specify population, denominator, period, uncertainty, and one descriptive claim. Explain how class may intersect with race, gender, or place, then give two mechanisms and evidence that could distinguish them.
The model solution is available in the restricted instructor materials.
4.7 Power can change both the size and division of gains
Return to the strike. Collective action changed who could credibly withhold cooperation and how long each side could withstand disagreement. The resulting contract concerned distribution—pay, benefits, and security—but workplace rules can also affect turnover, information, effort, investment, and productivity. Power therefore shapes both how gains are divided and, sometimes, how large the gains become.
The WS–PS model remains useful if we resist turning every institution into one arrow. Bargaining may change the wage negotiated at a given employment level. Voice may change effort costs and productivity. Market power may alter the markup and outside options. Public insurance may change risk and search. Group inequality may reflect different exposure to all of these channels.
A careful conclusion states the goal, the mechanism, the distributional consequences, and the evidence. It also asks whose outcomes are averaged together. That is how a model of wages and prices becomes an analysis of power and inequality rather than a diagram with renamed curves.
The chapter’s models also clarify what must be kept separate. The three-class income table is an accounting construction. WS, PS, and the monopsony example are behavioral relationships built under different assumptions. A claim that the 2023 UAW strike caused a later wage, price, employment, or productivity outcome requires a credible empirical comparison. A claim about the economy-wide effect must also trace how many firms, workers, consumers, and public institutions respond. Keeping those forms of reasoning distinct makes room for disagreement without making every explanation equally persuasive.
Return once more to the opening evidence. The decline in national union membership describes a change in one institution; it does not prove that the change caused any particular movement in inequality. The strike shows organized workers changing the feasible choices in a specific negotiation; it does not reveal the counterfactual contract by itself. The theory tells us which channels to investigate—bargaining, voice, conflict, productivity, markups, employment, and risk. The evidence must tell us which channels operated, for whom, and with what magnitude.
That combination is the chapter’s practical skill: start with people and institutions, translate their choices into a mechanism, trace the changed conditions one at a time, and then return to evidence that can distinguish among the possible stories.
Seeing the principles in action
| Principle | Example | Everyday Economics |
|---|---|---|
| Interdependence principle | The UAW strike shows how workers, firms, suppliers, customers, and communities depend on one another through production and bargaining. | A request made by one worker can have a different outcome when coworkers, customers, and suppliers also respond. |
| Doing the best you can principle | Workers and firms choose bargaining strategies given outside options, strike costs, law, information, and expectations about the other side. | Holding out longer may improve an agreement but also increases the cost of delay. |
| Rules of the game principle — focal | Labor law, union recognition, unemployment insurance, wage floors, and employment protection change feasible actions and bargaining power. | The same workplace conflict can produce a different outcome when workers can organize or when dismissal rules change. |
| Trade-offs and opportunity costs principle | A strike sacrifices current pay and production for the possibility of a better agreement; institutions trade insurance, incentives, security, and adjustment in different ways. | What would you give up today to improve a rule that affects your future pay or schedule? |
| Principle of gains from cooperation and conflict of interest — focal | Employment and collective problem solving can raise output and benefit both workers and owners, while bargaining determines how gains, risk, and authority are divided. | A group project can produce more than separate work even when participants disagree over credit and responsibilities. |
| Principle of individual and societal interests — focal | A firm’s effort to reduce wages or a worker’s need to protect a job can be individually rational while producing insecurity, weak voice, or inefficient matching across the labor market. | Leaving a poor job may be sensible for one worker, while widespread turnover can reveal a workplace rule that harms everyone. |
| Principle of aggregation and feedback | Bargaining and market power at many firms aggregate into employment, labor shares, income distributions, prices, and feedback to workers’ outside options. | One pay agreement is local; many similar agreements can affect wage norms, spending, prices, and hiring. |
Skills and learning objectives
- Reading an analytical graph
- Reading and interpreting an empirical graph (and its terms)
- Illustrating concepts on a graph
- Seeing how institutions change game outcomes
- Adjusting a model in response to economic or institutional changes
- Understanding the difference between causality and correlation
- Explaining a causal mechanism
- Applying principles to a specific scenario
- Defining important economic terms
Concepts to learn
- Labor unions, collective bargaining, structural power, and bargaining power
- Earnings, income, wealth, market income, and disposable income
- Income shares, the Gini coefficient, and the provisional Lorenz curve
- Union bargaining, voice, cooperation, conflict, and productivity
- Product-market power, monopsony power, markups, and the labor share
- Labor-market institutions as packages of incentives, insurance, and power
- Economic class as ownership, authority, market dependence, risk, and access to institutions
- Intersections among class, race, gender, place, disability, and citizenship
- Group and place inequality, description, and institutional explanation
- Fairness, efficiency, and the size and division of gains
Glossary
Chapter 4 terms
labor union
An organization of workers that represents members in negotiations and other matters concerning pay, hours, conditions, and workplace rules.
See also: collective bargaining; bargaining power.
collective bargaining
Negotiation between workers represented as a group and an employer or employer organization over wages, conditions, and workplace rules.
See also: labor union; bargaining power.
structural power
Power arising from a person’s or group’s position in an interdependent economic or social system, such as the ability to interrupt a production bottleneck.
See also: bargaining power.
bargaining power
The ability to obtain a more favorable agreement, shaped by outside options, patience, organization, information, law, and the cost of disagreement.
See also: structural power; collective bargaining.
earnings
Payments received from work, defined according to the source and period being measured.
income
A flow of resources received over a period, which may include earnings, self-employment income, property income, and transfers depending on the definition.
See also: earnings; wealth; market income; disposable income.
wealth
A stock of assets minus debts measured at a point in time.
See also: income.
market income
Income before taxes and government transfers under a stated statistical definition.
See also: disposable income; income.
disposable income
Income available after direct taxes and transfers under a stated statistical definition.
See also: market income; income.
Gini coefficient
The Gini coefficient usually ranges from zero for complete equality to one for maximum inequality in the stylized limit. It summarizes an entire distribution in one number, so different distributions can have the same Gini and a change does not show where gains or losses occurred.
See also: income share; Lorenz curve.
Lorenz curve
The horizontal axis orders people from lowest to highest income and accumulates their population share; the vertical axis accumulates their income share. In this chapter, unemployment determines the initial flat segment and wages and profits determine later segments. Distance below the line of equality describes inequality but does not identify its causes.
See also: income share; Gini coefficient; whole-economy model.
whole-economy model
A linked WS–PS and Lorenz-curve model in which employment, real wages, and profits determine a simplified distribution of market income among unemployed people, workers, and owners.
See also: Lorenz curve; income share; labor share.
monopsony power
Employer power that arises when workers’ labor supply to a firm is not perfectly responsive to the wage and conditions it offers.
See also: bargaining power; labor share.
labor-market institution
A formal or informal rule shaping employment relationships, worker and firm choices, and labor-market outcomes.
See also: collective bargaining; bargaining power.
economic class
Economic class is multidimensional. Income and education are useful measures, but class also concerns who owns, who directs work, who bears risk, whose livelihood depends on selling labor, and which collective or family resources support outside options. Class intersects with race, gender, place, disability, and citizenship without being reducible to any one of them.
See also: wealth; income; structural power; whole-economy model.
Flashcards
What is structural power?
Power arising from a person’s or group’s position in an interdependent system, such as the ability to interrupt a bottleneck.
What does a Lorenz curve show?
The cumulative share of income received by cumulative shares of people ordered from lowest to highest income.
What is the union voice effect?
Worker representation can improve communication, treatment, job satisfaction, problem solving, and potentially productivity.
Why evaluate institutions through several channels?
An institution can change incentives, insurance, bargaining power, matching, productivity, distribution, and employment at the same time.
Questions
Question 4.7. What is the chapter’s main claim about power?
- Power changes distribution but never efficiency
- Power can affect both the size of gains from cooperation and how they are divided
- Power is fully measured by union membership
- Institutions eliminate all conflicts
Exercise
Size and division of gains
Describe one institution that could change both productivity and distribution. State the mechanism, who might gain or lose, and what evidence would change your conclusion.
The model solution is available in the restricted instructor materials.