The US Macroeconomy in Data
Download the current dated PDF snapshot
Public working draft: This is an AI-assisted chapter skeleton for coauthor revision, not an approved manuscript. It deliberately mixes developed passages, drafting bullets, provisional figures, and visible review flags. The named Google Doc remains canonical during drafting. Publication on this site means “open for review,” not “fact-checked” or “data-manager approved.”
Learning objectives
By the end of this chapter, you should be able to:
- distinguish a level, a change, a growth rate, a percentage, and an index number;
- interpret output, employment, unemployment, participation, inflation, productivity, and real-earnings measures using their definitions and denominators;
- identify how aggregation and classification affect a macroeconomic statistic;
- use FRED metadata to document a series and distinguish an observation from a causal claim;
- explain why an economy can grow while the economic experiences of many households remain insecure; and
- formulate questions about a graph that later chapters can answer with models and additional evidence.
1.1 Three moments of entry into the US economy
Imagine that you are finishing school and deciding what comes next. Do you look for a job immediately, continue your education, or try to establish an independent household? The choices are personal, but the conditions surrounding them are not. Employers may be hiring or cutting jobs. Credit may be easy or difficult to obtain. Housing and other necessities may be affordable relative to pay—or may not be.
Now place that decision at three different moments in US economic history: 1950, 2009, and 2020. These dates do not stand for three representative lives. People entering adulthood at the same time differed in race, gender, class, citizenship, disability, family resources, place, and access to institutions. The dates are comparison points that let us ask how the economy surrounding a decision can change.
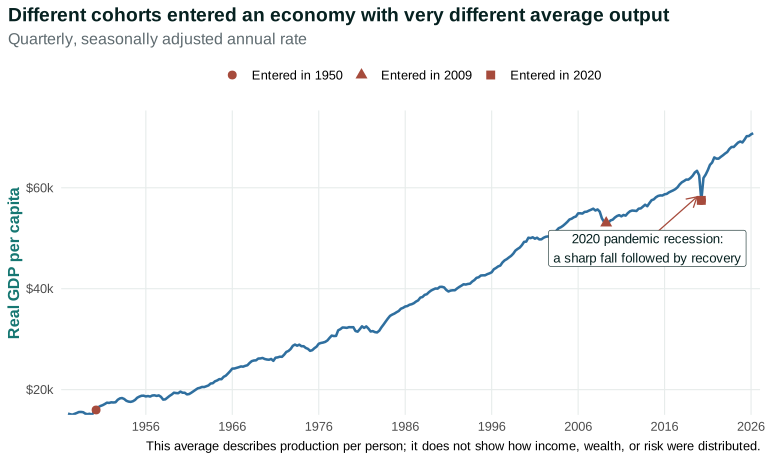
Figure 1.1 begins with one widely used measure of those changing conditions: real GDP per capita. Real gross domestic product, or real GDP, measures the inflation-adjusted value of final goods and services produced within a country. Dividing by population turns an economy-wide total into an average per person.
Reading the opening evidence one step at a time
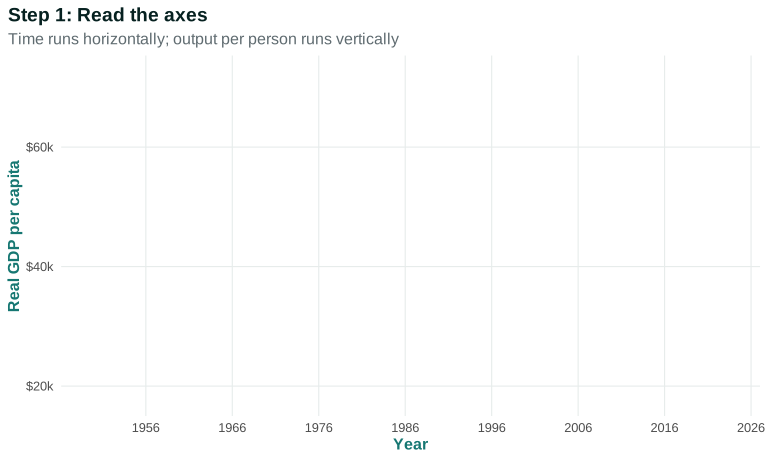
The horizontal axis shows time in years. The vertical axis shows the level of real GDP per capita. The dollar signs and “k” tick labels mean thousands of dollars; the technical price basis belongs in the caption rather than on the axis.
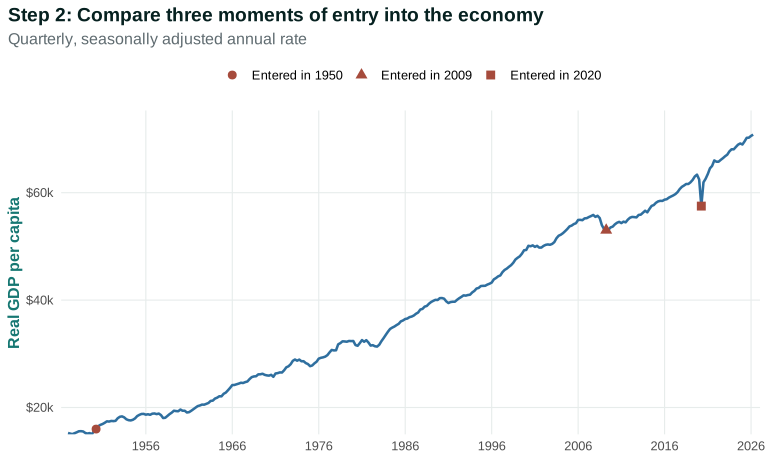
Start with 1950 and 2009. In the pinned series, real GDP per person is about $16,000 in the second quarter of 1950 and about $53,000 in the second quarter of 2009. The long-run increase is large. It tells us that the US economy had become capable of producing far more per person. It does not tell us that every household received the average, that access to work and housing was equal, or that more production improved every dimension of life.
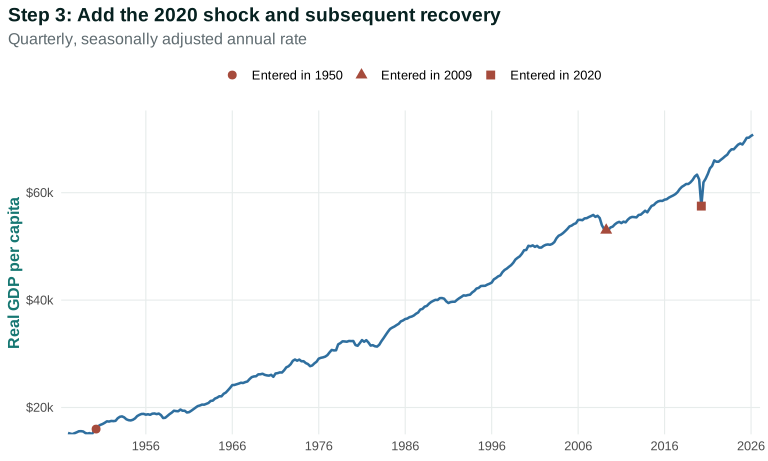
Next compare the end of 2019 with the second quarter of 2020. Real GDP per person falls from about $63,400 to $57,500—a decline of roughly 9 percent in two quarters—before recovering. The fall is an empirical description. The line alone cannot tell us which workers lost jobs, which people could work remotely, which firms closed, how risks were distributed, or which public-health and policy decisions shaped the outcome.
What “chained 2017 dollars” means and how the series is constructed.
Only the final step annotates the 2020 episode. The annotation directs attention to a date and pattern; it does not make the annotation itself evidence of causation.
Why might the moment of entry matter? Research by economists Hannes Schwandt and Till von Wachter follows US labor-market entrants across several decades. They find that entering when unemployment is higher is associated with persistent average losses in earnings and employment, with larger effects for less advantaged entrants. This evidence gives us a reason to investigate timing. It does not imply that everyone entering in 2009 had the same experience or that the GDP line by itself caused later outcomes.
The comparison therefore leaves us with a puzzle. By the aggregate production measure, a person entering adulthood in 2020 lived in a much richer economy than a person entering in 1950. Yet a higher average level of production does not answer the questions that matter for an individual decision:
- Can I find paid work, and how secure will it be?
- Will my pay rise faster than the prices of the things I buy?
- Can I afford housing, healthcare, education, and time away from paid work?
- Who has authority to set the rules shaping my options?
- If the economy is said to be doing well, whose experience does that description fit?
Macroeconomics studies the economy as a whole. Doing that requires aggregation: combining the actions and circumstances of many people, firms, governments, goods, prices, and transactions into totals, averages, and rates. Aggregation is essential, but it compresses information. A national average can rise while many people are worse off. A low unemployment rate can coexist with people leaving the labor force. A lower inflation rate means prices are rising more slowly; it does not mean that the price level has returned to where it was. TE 2.0 §1.9
One measure cannot distinguish production, access to work, changing prices, distribution, public provision, political participation, and who bears risk. We therefore need a dashboard whose measures answer different questions. The rest of the chapter builds that dashboard. It begins with measurement because a graph may show what changed without establishing why it changed; later chapters develop the mechanisms that can explain the patterns.
The interdependence principle tells us that a household’s possibilities depend on decisions and events elsewhere: employers’ hiring, other workers’ job searches, the banking system, government policy, technological change, and developments in other countries. The macroeconomy is a system of interacting parts, not a collection of isolated choices.
Source and drafting note. Figure 1.1 uses the US Bureau of Economic Analysis real-GDP-per-person series retrieved through FRED. The recession-entry result comes from the NBER study by Schwandt and von Wachter. The prose above is original synthesis; the three dates are illustrative comparison points rather than historical composites.
Questions
Question 1.1. What is the main reason economists aggregate individual activity into macroeconomic statistics?
- To eliminate differences among households
- To construct economy-wide totals, rates, and averages
- To prove which policies caused an outcome
- To ensure every household is represented by the average
Exercise
Reading an aggregate claim
A headline says, “The economy grew, so Americans became better off.” Identify one aggregate measure that could support part of the headline, then identify two kinds of household-level information you would need before accepting the full claim.
The model solution is available in the restricted instructor materials.
1.2 Reading a macroeconomic dashboard
A dashboard does not answer every question. It gives us a disciplined place to begin. Before interpreting any graph, identify:
- Variable: What is being measured?
- Population and denominator: Who or what is included, and what is the total against which the measure is compared?
- Units: Dollars, people, percent, percentage points, an index, or a growth rate?
- Frequency: Monthly, quarterly, or annual?
- Adjustment: Is the series seasonally adjusted? Is a dollar series nominal or real?
- Time period and data vintage: Which observations are shown, and when were they downloaded or revised?
- Source: Which agency produced the measure, and how does it define it?
Consider the official unemployment rate. It is often reported as a single number, but the number is built from decisions about how people are classified. Before reading the line in Figure 1.2, classify the people in the following cases.
| Case | Survey facts | Official classification |
|---|---|---|
| Worked | Worked at least one paid or self-employed hour in the survey week | Employed |
| Temporarily absent | Had a job but was temporarily absent during the survey week | Employed |
| Actively searching | No job; available; actively searched in the previous four weeks | Unemployed |
| Temporary layoff | No job; expects recall from a temporary layoff | Unemployed |
| Wants work, no recent search | No job; wants work; no active search in the previous four weeks | Not in labor force |
The table separates three groups. Employed people include those who did at least one hour of paid or self-employed work during the survey reference week and people who had a job but were temporarily absent. Unemployed people had no job, were available for work, and had actively searched during the previous four weeks; people expecting recall from a temporary layoff can count as unemployed without active search. Everyone else is outside the labor force under the official definition, including some people who want a job.
The labor force is the employed plus the unemployed. The official unemployment rate therefore divides unemployed people by the labor force—not by everyone without a job and not by the entire adult population. If an unemployed person stops actively searching, the unemployment rate can fall because that person leaves both the numerator and the denominator, even though nobody found a job.
The broader population behind the participation and employment rates is the civilian noninstitutional population age 16 and older. It excludes people on active duty in the Armed Forces and people living in institutions such as prisons or nursing facilities. The definition is an institutional measurement choice. It is not a judgment about whether people outside the measured labor force contribute to the economy or want paid work.
Reading the unemployment figure one step at a time
The final figure and every step below are produced by the same R script from the same pinned data. The steps change what the student is asked to notice; they do not silently substitute a different dataset.
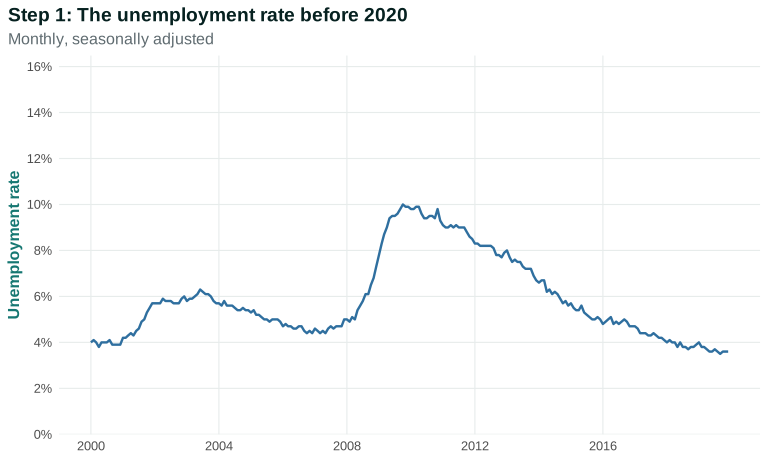
Read the axes before reading the story. The series is monthly, measured as a percent of the labor force, and seasonally adjusted. Between 2000 and 2019 it rises around downturns and falls during expansions. That pattern is descriptive: it does not by itself tell us what caused any rise or fall.
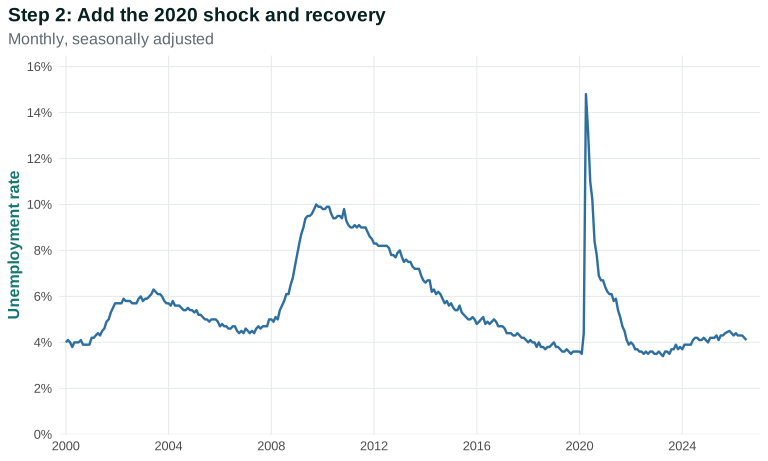
The April 2020 movement is not a small continuation of the preceding pattern. The current pinned series records 14.8 percent after later revisions; the unemployment rate reported in the contemporaneous April 2020 release was 14.7 percent. A data value can therefore depend on its vintage as well as its date.
April 2020 also created an unusual classification problem. The Bureau of Labor Statistics found that some people absent from work because of pandemic-related closures were recorded as employed but absent for “other reasons.” They should instead have been asked the follow-up questions used to determine whether someone was on temporary layoff. BLS did not replace the official estimate with an improvised corrected number, and the exact counterfactual rate is not known.
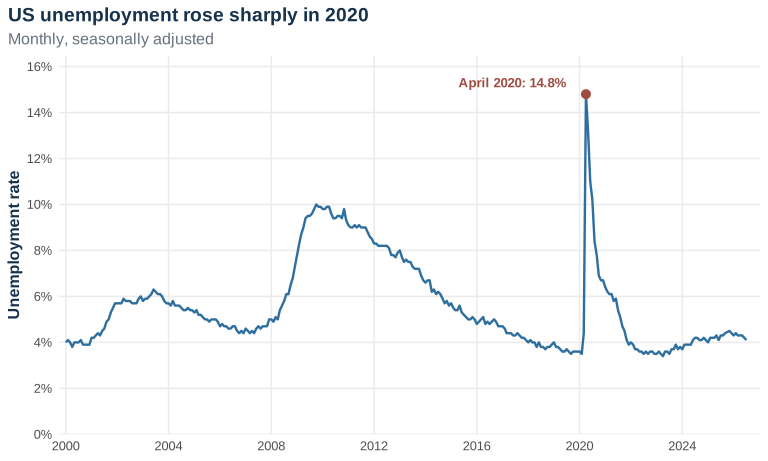
The final figure marks the revised April 2020 value. Annotation directs attention; it does not add causal evidence. To explain the spike and recovery, we need institutional knowledge, other data, and a model of how the public-health emergency, household and firm decisions, and policy responses affected work and hiring.
Everyday Economics 1.1
What can one graph tell us?
Suppose a news story uses Figure 1.2 to claim that a particular policy caused unemployment to fall. What additional comparison or evidence would you want? Then consider a person who is unemployed and stops searching without finding a job. State what happens immediately to the unemployment-rate numerator and denominator, and explain why the resulting change need not mean that the labor market improved.
Draft data review flag. Classifications and formulas follow the BLS Current Population Survey definitions. The April 2020 vintage and classification discussion follows the BLS review of pandemic misclassification. Figure 1.2 uses the BLS unemployment series retrieved through FRED. The main text uses “official unemployment rate”; the labels U-3 through U-6 are deferred to optional material. Final data-manager review remains required.
Questions
Review the live step-by-step figure
Question 1.2. Before interpreting a time-series graph, which information is most important to identify?
- Only the title and the final observation
- The variable, denominator, units, frequency, adjustment, period or vintage, and source
- Whether the line rises more often than it falls
- The policy preferred by the person who made the graph
Exercise
Audit a headline statistic
Choose Figure 1.1. Record its variable, denominator, units, frequency, seasonal adjustment, period, data vintage, and source. Then write one descriptive claim the figure supports and one causal claim it cannot establish by itself.
The model solution is available in the restricted instructor materials.
1.3 Growth and living standards
The opening Figure 1.1 shows real GDP per capita over time. Real GDP measures the inflation-adjusted value of final goods and services produced within the United States over a stated period. Dividing by population turns the economy-wide total into an average per person; it does not turn that average into anyone’s actual income. We now return to that evidence to separate the level from its rate of change, a total from a per-person measure, and an average from a distribution—and then ask what changes when the United States is placed beside other countries. UOE Micro Ch. 3 §3.2 and Math Extension 3.2
Three distinctions prevent common mistakes.
- Level versus growth rate. The height of the line is the level of real GDP per person. The steepness indicates how quickly it is changing. A recession can reduce the level for a time without erasing decades of earlier growth.
- Total versus per person. Total output can rise because the population grows. Dividing by population gives an average per person, which is more informative about potential living standards. TE 2.0 §1.3
- Average versus distribution. GDP per person is not the income of a typical household. It can rise while gains accrue mainly to a small group, while unpaid work increases, or while environmental quality declines. UOE Micro Math Extension 3.2
Rising output per person expands the set of goods and services a society could make available. It does not tell us which goods are produced, how they are distributed, how much free time people have, or whether production damages the physical environment. This is why the UOE Micro discussion of transformed living standards pairs GDP per person with measures of health, education, inequality, and environmental conditions. UOE Micro Ch. 3 §3.2
History’s hockey sticks: growth and divergence
For most of recorded history, estimated output per person changed slowly. Then some countries began sustained growth, but at different dates and speeds. The resulting lines resemble hockey sticks: a long, relatively flat shaft followed by a sharply rising blade. The timing matters. If one country’s line bends upward generations before another’s, even modest annual growth compounds into a large gap. Later growth can produce catch-up, as in South Korea, without guaranteeing convergence for every country. UOE Micro Ch. 3 §3.2
International comparisons require a common unit. Purchasing power parity, or PPP, adjusts for differences in what currencies can buy in different countries. It is more informative for material living standards than converting at a market exchange rate, but it is still an estimate built from prices, baskets, benchmarks, and historical reconstructions. UOE Micro Ch. 3 §3.2
Time is on the horizontal axis. GDP per capita is on the vertical axis. The vertical scale is proportional rather than arithmetic: moving from $1,000 to $2,000 takes the same distance as moving from $10,000 to $20,000 because both are doublings. This makes relative growth paths easier to compare.
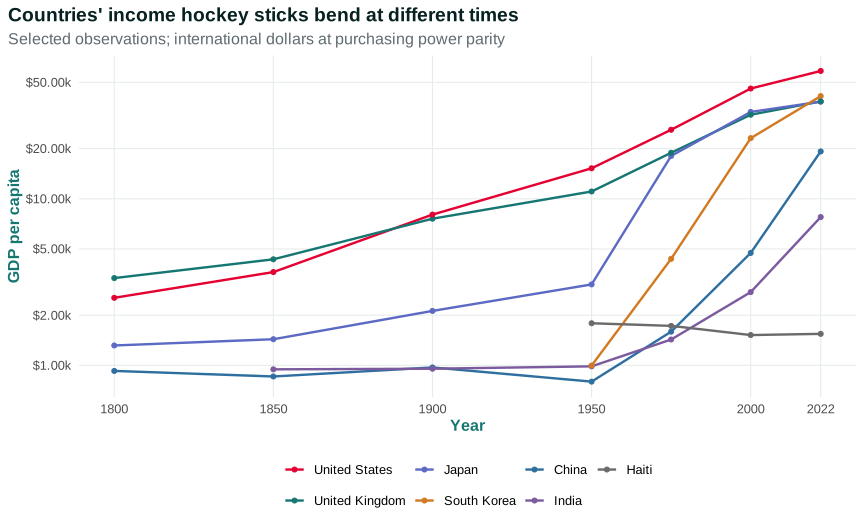
The United Kingdom and United States rise earlier. Japan and South Korea rise steeply later. China and India turn upward later still. Haiti’s selected observations remain near its mid-twentieth-century level. The graph therefore shows both transformation and divergence. It does not explain them; Chapters 14–16 will examine technology, institutions, political power, colonial histories, trade, and environmental constraints. UOE Micro Ch. 3 §3.2
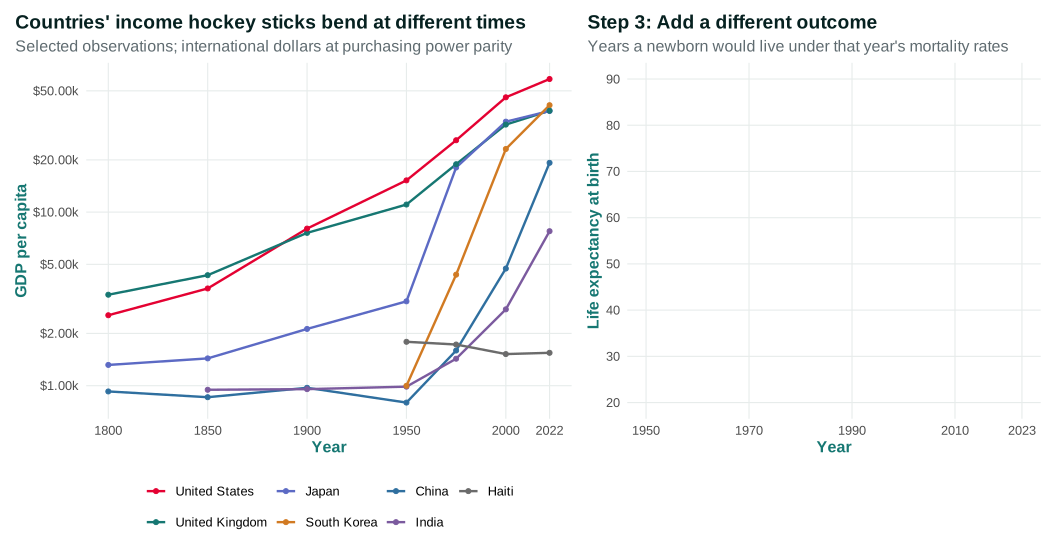
The second panel asks a different question. Life expectancy at birth summarizes the mortality rates people faced at each age in a particular year. It is not income, and it is not a forecast for a named child.
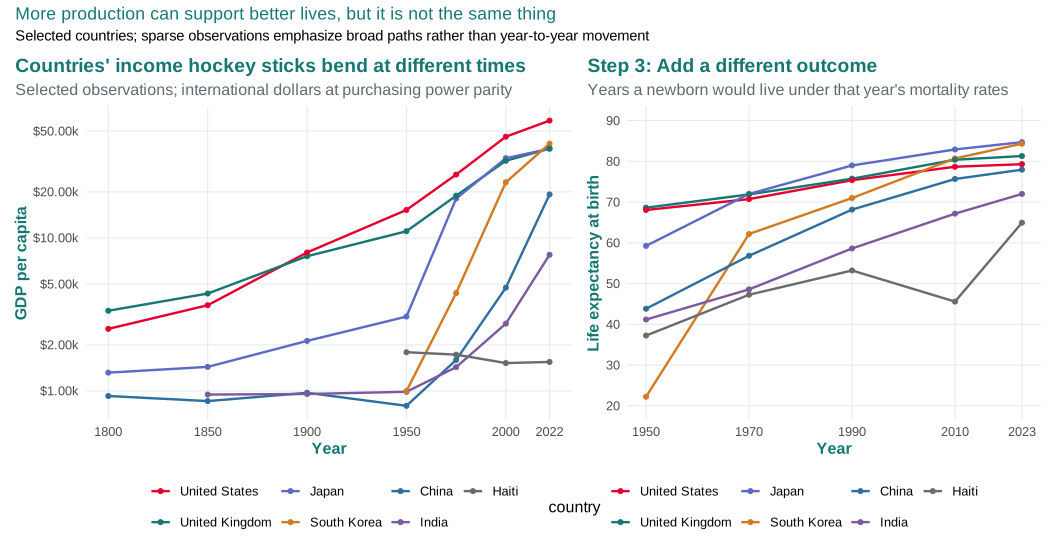
Life expectancy rises across all seven selected countries over the full period, though along very different paths. Japan and South Korea reach higher life expectancy than the United States despite lower GDP per capita. Haiti’s series also reminds us to investigate breaks and crises rather than read every line as smooth progress. Production can finance nutrition, sanitation, housing, education, and healthcare, but public action, social relationships, conflict, and access determine how resources become longer and healthier lives. UOE Micro Ch. 3 §3.2
Education adds another dimension. Average years of schooling and literacy help describe people’s capabilities, but years in school do not by themselves measure what students learned or whether access was equal. Political and legal institutions matter too. The ability to vote, organize, obtain identification, use public services, and receive equal treatment before the law can expand what people are able to do. These are not optional decorations on GDP. They are part of a person’s substantive opportunities, and they influence how resources and authority are distributed.
No single dashboard can collapse all of these dimensions into an uncontroversial number. A useful living-standards assessment therefore asks at least four questions:
- Resources: What goods, services, time, and environmental quality are available?
- Distribution: Who receives those resources, and how do class, race, gender, place, disability, and citizenship shape access?
- Capabilities: What can people actually be and do—live a healthy life, learn, work with dignity, participate politically, and seek justice?
- Institutions: Which rules, organizations, and power relationships produce those outcomes?
These questions also keep the international graph in its proper place. The figure establishes patterns worth explaining. It does not say that GDP alone caused life expectancy, that a country’s average describes every resident, or that one institutional package must fit every society.
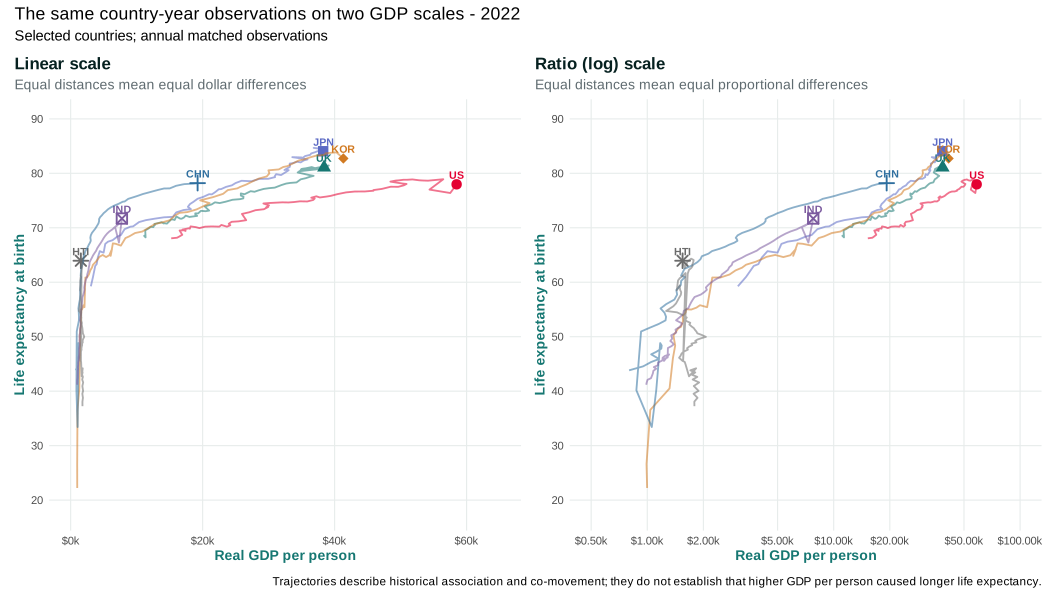
The international comparison above uses a ratio scale for GDP per person. This extension lets you see why. It places the same country-year observations on two horizontal GDP scales and changes only the scale—not the data.
On the linear scale, equal horizontal distances mean equal dollar differences. A move from $1,000 to $2,000 occupies much less space than a move from $20,000 to $40,000, even though both are doublings. On the ratio, or logarithmic, scale, equal horizontal distances mean equal proportional differences. Both doublings therefore occupy the same distance.
Use the controls to follow annual observations from 1950 through 2022. The trails show where each country has been; the labeled point shows its value in the selected year. Play does not start automatically. You can pause, move one year at a time, restart, or use the year slider with a keyboard. If your device requests reduced motion, playback is disabled and all manual controls remain available.
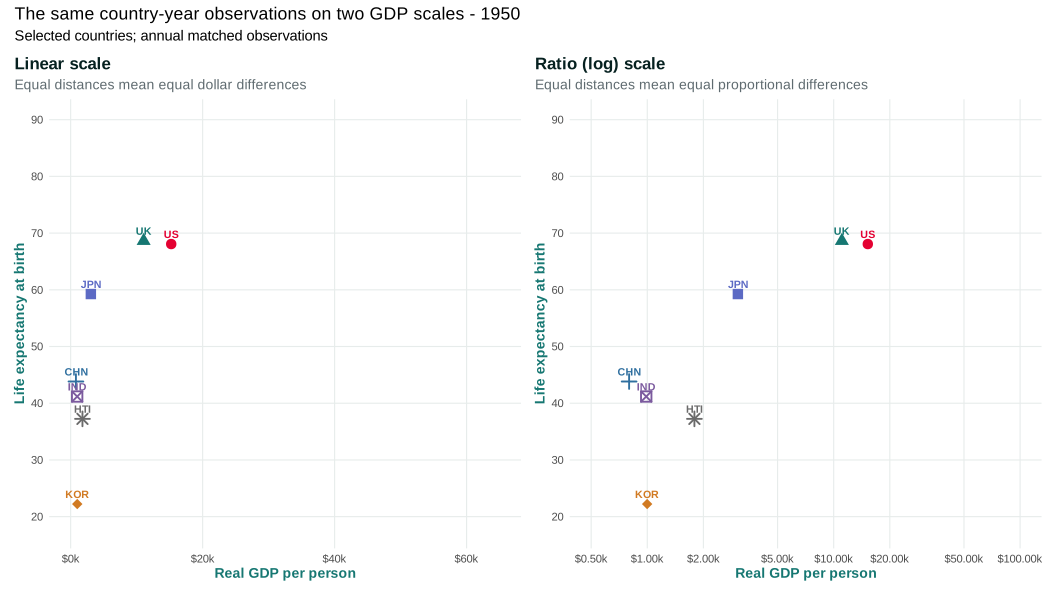
Selected year 1950.
Playback is disabled because your device requests reduced motion. Use Previous year, Next year, or the slider.
Read the selected-year values as a table
| Country | Real GDP per person | Life expectancy |
|---|
Compare the two panels at a low-income year for China, India, or South Korea. The linear scale places their points close together near the left edge. The ratio scale separates proportional differences, making it easier to compare growth paths that begin at very different income levels. Neither scale is universally “correct”: the useful scale depends on whether the question concerns absolute or proportional change.
Questions
Review the time-controlled figure
Why does a move from $1,000 to $2,000 occupy the same horizontal distance as a move from $20,000 to $40,000 on the ratio scale?
- Both changes are 100% increases
- Both changes add the same number of dollars
- The log scale changes the underlying data
- Life expectancy is also plotted logarithmically
Exercise
Choose one country and two years in the animation. Record its GDP per person and life expectancy in both years. Calculate the absolute GDP-per-person increase and the proportional increase. Explain which panel makes each change easier to see, then state one causal claim the trajectories cannot establish.
Draft data review flag. Every annual frame, the printable state, and the selected-year table are generated from the same pinned and matched data. Final review must confirm the country subset, annual merge, historical uncertainty, provider and underlying-source terms, keyboard behavior, reduced-motion behavior, and accessible descriptions.
Everyday Economics 1.2
A richer economy and an unaffordable apartment
A graduating student may hear that real GDP per person is near a record high while finding rent unaffordable. These claims are not contradictory. One is an average measure of production; the other depends on local housing supply, the student’s income and wealth, credit conditions, household size, and the rules governing land use and housing.
Draft source and reuse note. The distinctions between totals, averages, well-being, and distribution, and the hockey-stick sequence, adapt material from UOE Micro, Chapter 3 and the discussion of aggregate measurement in The Economy 2.0: Macroeconomics, Section 1.3. The capabilities and institutional-access questions are new drafting scaffolds for coauthor review. Chapter 5 will provide the full GDP accounting treatment; Chapters 15–16 will explain growth and divergence.
Note for fact checkers: Check the selected Maddison and life-expectancy observations against the complete OWID metadata, especially historical uncertainty, South Korea’s 1950 mortality estimate, and the Haiti break. Review the PPP explanation and the distinction between period life expectancy and a cohort forecast. Political participation is added as a separate descriptive measure in Section 1.7; education and equal-justice indicators remain outside the introductory dashboard unless a later editorial decision reopens them.
Questions
Review the live step-by-step figure
Question 1.3. Figure 1.1 shows US real GDP per person rising over most of the postwar period. Which statement best interprets the figure?
- Every US household’s real income rose in every quarter
- The inflation rate rose because the level of real GDP per person rose
- Average inflation-adjusted domestic production per person rose substantially over the long run
- The US population must have fallen
Question 1.4. Mean income rises while median income falls. Which conclusion is justified?
- Every household received an income gain
- The income distribution must be unchanged
- Large gains near the top could raise the mean even while the middle household loses
- The price level must have fallen
Exercise
Level, growth, and distribution
Compare 2007, 2009, and 2025 in Figure 1.2. Describe what happened to the level of real GDP per capita, distinguish a temporary decline from the long-run trend, and explain why the figure does not reveal what happened to the median household.
The model solution is available in the restricted instructor materials.
1.4 Jobs, unemployment, and participation
Whether people have paid work matters for income, security, social connection, and bargaining power. But no single labor-market statistic captures all of this.
Start with the working-age population and sort people into three broad groups:
- Employed: did paid work during the survey reference period, or had a job from which they were temporarily absent.
- Unemployed: did not have a job, were available for work, and had actively looked for work within the relevant period (with specific treatment for temporary layoffs).
- Not in the labor force: neither employed nor classified as unemployed. This group includes many students, retirees, caregivers, people with disabilities, and people who want work but do not meet the active-search definition.
The labor force is employed plus unemployed people. From these groups we can construct several rates:
\[ \text{unemployment rate}=\frac{\text{unemployed}}{\text{labor force}}\times 100 \]
\[ \text{labor force participation rate}=\frac{\text{labor force}}{\text{civilian noninstitutional population aged 16+}}\times 100 \]
\[ \text{employment-population ratio}=\frac{\text{employed}}{\text{civilian noninstitutional population aged 16+}}\times 100 \]
These denominators matter. The labor force participation rate and employment-population ratio use a broader population than the unemployment rate. If an unemployed person stops searching and leaves the labor force, the unemployment rate can fall even though nobody found a job. The participation rate and employment-population ratio help us see different parts of the change.
National totals also hide group differences. Employment opportunities and unemployment risks differ by race and ethnicity, gender, age, disability, education, location, and immigration status. A later draft should add a carefully chosen distributional figure rather than treating the headline rate as everyone’s experience.
Draft data review flag: Check every classification above against current BLS CPS definitions, including the age and civilian noninstitutional-population denominator. The main sequence uses “official unemployment rate”; the U-3 through U-6 labels remain deferred to optional material.
Questions
Question 1.5. Which person is classified as unemployed in the headline US measure?
- A person without a job who wants work but has not actively searched recently
- A retired person who does not want paid work
- A person without a job who is available and has actively searched for work
- A part-time worker who would prefer full-time hours
Question 1.6. The number of unemployed people is unchanged, but some employed people leave the labor force. What happens to the unemployment rate, other things equal?
- It rises
- It falls
- It is unchanged
- There is not enough information
Review the live step-by-step figure
Question 1.7. Why might the unemployment rate fall while the employment-population ratio does not rise?
- Some unemployed people may leave the labor force without becoming employed
- The two measures always use the same numerator
- A lower unemployment rate mechanically lowers employment
- Seasonal adjustment forces the two series to move in opposite directions
Exercise
Classifying the labor force
Suppose 165 million people are employed, 7 million are unemployed and actively searching, and 98 million are outside the labor force. Calculate the labor force, unemployment rate, participation rate, and employment-population ratio. Then describe one change that lowers measured unemployment without raising employment.
The model solution is available in the restricted instructor materials.
The headline unemployment rate is familiar, but it is only one view of the labor market. This extension compares it with the labor-force participation rate and the employment–population ratio. All three series come from the Current Population Survey, are monthly and seasonally adjusted, and use percentages. They answer different questions because their numerators and denominators differ.
Why add two more measures?
The unemployment rate asks: among people who are employed or officially unemployed, what share is unemployed? The participation rate asks: what share of the civilian noninstitutional population age 16 and older is employed or unemployed? The employment–population ratio asks: what share of that population is employed?
These classifications imply an accounting relationship. Apart from rounding, the employment–population ratio equals the participation rate multiplied by one minus the unemployment rate expressed as a decimal. This relationship follows from the definitions. It does not explain why any of the three rates changes.
Build the figure one measure at a time
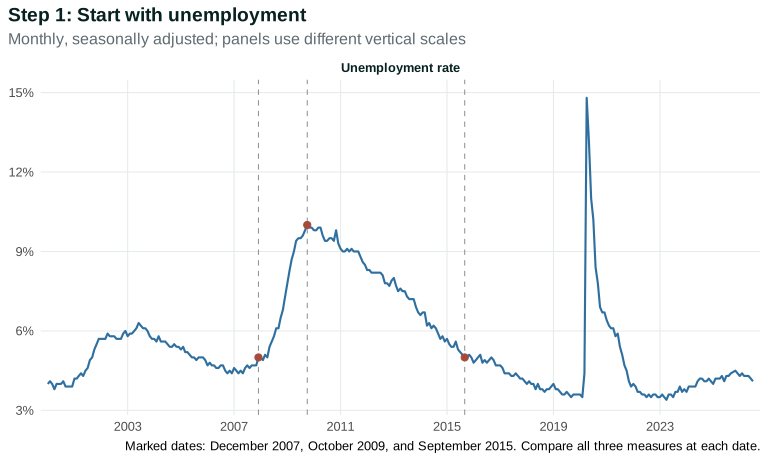
Begin with the numerator and denominator. In December 2007, 5.0 percent of the labor force was unemployed. The rate reached 10.0 percent in October 2009. By September 2015 it had returned to 5.0 percent. If we stopped with this panel, we might describe the labor market as having returned to its earlier condition.
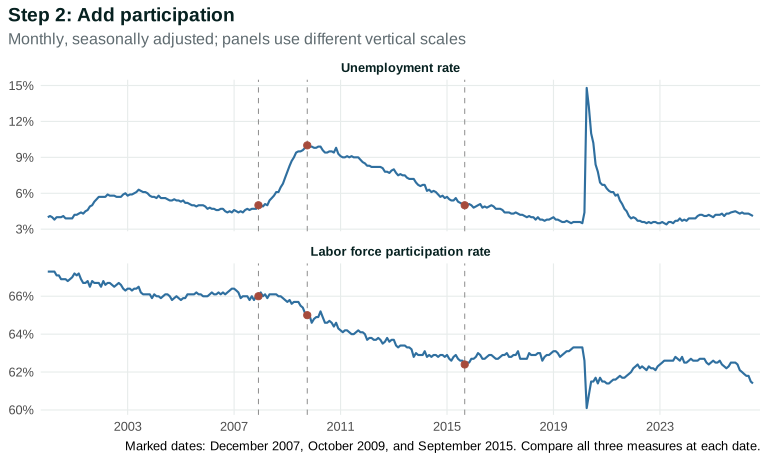
The second panel changes the denominator to the civilian noninstitutional population age 16 and older. Participation was 66.0 percent in December 2007, 65.0 percent in October 2009, and 62.4 percent in September 2015. The unemployment rate had returned to 5.0 percent by 2015, but a smaller share of the population was in the labor force.
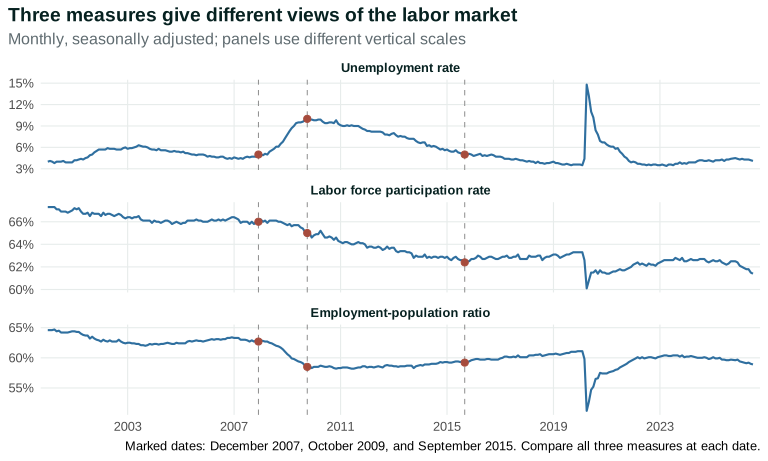
The third panel asks directly what share of the population was employed. The ratio was 62.7 percent in December 2007, 58.5 percent in October 2009, and 59.2 percent in September 2015. It had recovered from its 2009 level, but it remained 3.5 percentage points below its December 2007 level.
Named comparison: recession and recovery
| Date | Unemployment rate | Participation rate | Employment–population ratio |
|---|---|---|---|
| December 2007 | 5.0% | 66.0% | 62.7% |
| October 2009 | 10.0% | 65.0% | 58.5% |
| September 2015 | 5.0% | 62.4% | 59.2% |
The table gives us a disciplined conclusion: an unemployment rate of 5.0 percent did not describe the same aggregate labor-market condition in December 2007 and September 2015. Participation and employment relative to population were lower in 2015. The definitions show how this can happen. They do not tell us why it happened.
Explaining the changes would require additional evidence about labor demand, population aging, schooling, caregiving, disability, health, discouragement, migration, institutions, and policy. Aggregate measures can also conceal different experiences by race, gender, age, disability, place, citizenship, and class. The dashboard establishes a puzzle for later chapters; it does not decompose the causes.
Read the metadata
Use the FRED pages for UNRATE, CIVPART, and EMRATIO to verify the title, originating agency, units, frequency, seasonal adjustment, observation period, and last update for each series. A current endpoint belongs in the pinned data and metadata, not in prose that becomes stale after the next release.
Your investigation
- Use the three named dates to confirm the changes reported above. When subtracting one rate from another, report the difference in percentage points.
- Use the accounting relationship to estimate the September 2015 employment–population ratio from the participation and unemployment rates. Explain any small difference caused by rounding.
- Examine February and April 2020. Describe how the three measures moved, then explain why the April unemployment estimate requires the vintage and classification caution introduced with Figure 1.2.
- Write one causal explanation consistent with the 2007–2015 pattern and name one additional series or comparison needed to investigate it.
Draft data review flag: Figure 1.4 is reproducible offline from pinned public FRED snapshots, but it is not yet data-manager approved. Definitions follow the BLS Current Population Survey; the named values come from the common monthly pinned file used to build the figure. Final review must verify series definitions, vintages, seasonal adjustment, representative values, accessibility text, and redistribution terms.
Questions
Review the live step-by-step figure
Question 1.E1. Five unemployed people stop searching while employment is unchanged. Which pair of measures reveals that nobody found work?
- A lower unemployment rate and unchanged employment-population ratio
- A lower unemployment rate and higher employment-population ratio
- An unchanged unemployment rate and lower participation rate
- A higher unemployment rate and unchanged participation rate
Exercise
Classification changes the dashboard
An economy has 200 working-age adults: 120 are employed, 10 are unemployed and actively searching, and 70 are outside the labor force. Calculate all three rates. Then suppose five unemployed people stop searching while employment is unchanged. Recalculate the rates and explain which headline could misleadingly sound positive.
The model solution is available in the restricted instructor materials.
1.5 Inflation and the cost of living
The price level is an index summarizing the prices of a basket of goods and services. Inflation is the rate at which that price level changes. The distinction is easiest to see with an example. If the price index rises from 100 to 110, inflation is 10%. If it then rises from 110 to 112.2, inflation has fallen to 2%, but the price level has not fallen back to 100. TE 2.0 §1.4 price-index concept
Figure 1.5 calculates the percentage change in the seasonally adjusted Consumer Price Index from the same month one year earlier.
Reading Figure 1.4 one step at a time
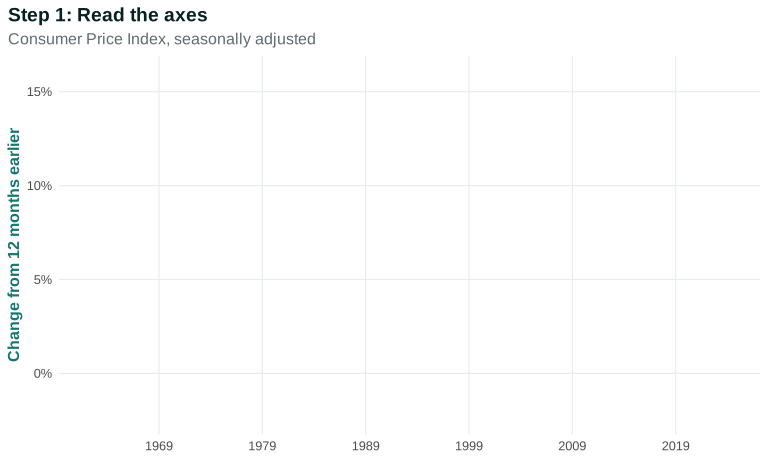
The horizontal axis shows time. The vertical axis shows a rate of change, not the level of prices: the percentage change in the CPI from the same month one year earlier. A value above zero means the overall price level is higher than 12 months earlier.
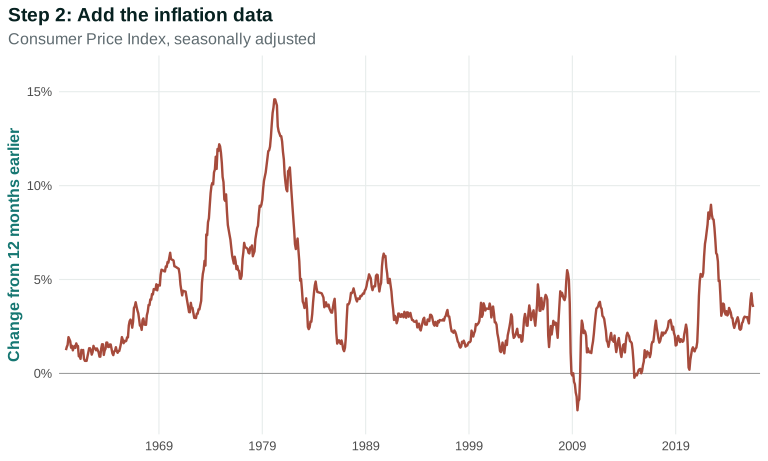
The line lets us identify when inflation was high, low, rising, or falling. It still does not tell us why. In particular, a single CPI series cannot separate changes in demand, energy and other input costs, supply disruptions, wages, markups, expectations, and policy.
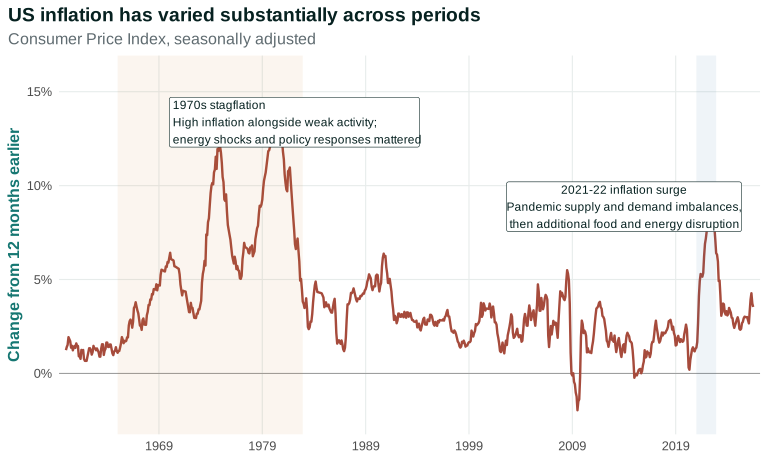
The final step highlights two periods. During the 1970s, high inflation coincided with weak economic activity and repeated energy shocks; monetary and fiscal policy, expectations, and the collapse of the earlier monetary framework also form part of the historical account (Bryan 2013). In 2021–22, pandemic-related supply constraints met strong demand, followed by additional food and energy disruption after Russia’s invasion of Ukraine (Shapiro 2022). These sources support treating each episode as multi-causal rather than attaching a single cause to a peak in the line.
The figure shows that inflation has not been constant. It was high and volatile in the 1970s and early 1980s, lower for much of the following four decades, and rose sharply after 2020 before declining. The graph alone cannot tell us how much of an episode came from energy prices, supply disruption, demand, wages, markups, expectations, or policy. Chapters 7 and 8 will develop those distinctions.
The national CPI also does not equal every household’s cost of living. Households buy different bundles. A renter facing a new lease, a driver with a long commute, and a retired homeowner with substantial medical expenses may experience the same period differently. An average index remains useful, but interpretation requires attention to weights, institutions, and distribution.
A real wage adjusts a nominal wage for the price level. It asks what the wage can buy, rather than how many dollars appear on a pay statement. TE 2.0 §1.4
Everyday Economics 1.3
Inflation falling is not prices falling
If inflation falls from 8% to 3%, prices are still rising on average—just more slowly. A fall in the price level is deflation. When discussing your own budget, separate the change in the overall index from changes in the particular prices and quantities that matter to your household.
Draft source and reuse note. The price-basket concept and real-wage purchasing-power definition adapt The Economy 2.0: Macroeconomics, Section 1.4. The inflation-rate-versus-price-level example and the discussion of different household baskets are original synthesis. Chapter 1 introduces the measurement logic only; the full inflation mechanism belongs later.
Questions
Review the live step-by-step figure
Question 1.8. Inflation falls from 8% to 3% and remains positive. What happens to the general price level?
- It falls by 5%
- It returns to its level before the 8% increase
- It continues to rise, but more slowly
- It is unchanged because inflation fell
Question 1.9. The unemployment rate rises from 4% to 5%. Which statement correctly describes the change?
- It rose by one percentage point and by 25% relative to its initial value
- It rose by 1% and one percentage point means the same thing
- It rose by five percentage points
- It rose by 0.25 percentage points
Exercise
Prices and inflation
A price index is 120 in Year 1, 126 in Year 2, and 129.15 in Year 3. Calculate inflation in each interval. Did the price level fall when inflation fell? If a worker’s nominal wage rose 3% from Year 2 to Year 3, what happened approximately to the worker’s real wage?
The model solution is available in the restricted instructor materials.
1.6 Recessions, crises, and recoveries
The long-run rise in output is not smooth. A recession is a broad contraction in economic activity. A recovery is a period in which activity expands after a trough. The National Bureau of Economic Research (NBER) dates US business-cycle peaks and troughs using several monthly and quarterly indicators. Its dates classify when a contraction began and ended; they do not, by themselves, identify its cause.
The table compares three recent contractions using a common set of questions. Duration measures the time from the NBER peak to the trough. The GDP-per-person change measures depth over a stated quarterly interval. The unemployment columns show how high the revised monthly series rose and when that happened.
| Episode | NBER peak–trough (duration) | Real GDP per person change | Highest unemployment | Timing of highest unemployment |
|---|---|---|---|---|
| 2001 recession | Mar.–Nov. 2001 (8 months) | −0.3% | 6.3% | June 2003, 19 months after the trough |
| Great Recession | Dec. 2007–June 2009 (18 months) | −5.1% | 10.0% | October 2009, 4 months after the trough |
| Pandemic recession | Feb.–Apr. 2020 (2 months) | −9.2% | 14.8% (revised) | April 2020, the trough month |
The episodes rank differently depending on what we ask. The pandemic recession was shortest by peak-to-trough duration and deepest by this GDP-per-person comparison. The Great Recession lasted much longer. In the 2001 episode, the highest unemployment rate arrived well after the NBER trough. The end of a recession therefore does not mean that output, employment, income, or household security has returned to its earlier path.
The GDP calculations also require a convention because GDP is quarterly while NBER dates are monthly. The table compares 2001 Q1 with 2001 Q4, 2007 Q4 with 2009 Q2, and 2019 Q4 with 2020 Q2. A different alignment would produce somewhat different magnitudes. That is a measurement choice to state, not hide. The April 2020 unemployment value is the revised value in the pinned series; the first official release reported 14.7 percent and faced the classification problem discussed in Section 1.2.
Comparison is not explanation. The 2001 contraction followed the end of the late-1990s investment and stock-market boom and was compounded by the September 11 attacks. The Great Recession involved falling house prices, mortgage defaults, financial fragility, and a severe credit contraction. The pandemic recession began amid a public-health emergency, voluntary changes in behavior, mandated restrictions, workplace risks, and an extraordinary policy response. These descriptions identify evidence a causal account must explain; chronology alone cannot choose among mechanisms or measure each contribution.
The costs were also distributed unevenly. Workers who lost jobs bore income and unemployment risk. Essential workers often remained employed while facing greater health risks. Renters, indebted households, small businesses, state and local governments, and asset owners entered each episode with different buffers and claims on resources. Rules governing unemployment insurance, paid leave, eviction, bankruptcy, credit, and public health changed who could adjust and who bore the loss.
The principle of aggregation and feedback asks whether reasoning that works for one actor still works when many actors behave similarly. If one household cuts spending to rebuild savings, it may become more financially secure. If many households cut spending together, firms may lose sales, reduce production, and cut jobs—feeding back into household income. Chapter 6 develops this mechanism. TE 2.0 §1.9
Questions for the comparison
- Which recession was longest? Which was deepest by the table’s GDP-per-person measure? Explain why these are different questions.
- In which episode did unemployment peak long after the NBER trough? Why does that make “the recession ended” an incomplete description of recovery?
- Choose one causal claim about an episode. Name evidence beyond the table that would help you evaluate it.
Draft source and data review note. Chronology follows the NBER business-cycle dates. GDP-per-person changes use the same pinned BEA series as the opening figure; unemployment peaks use the pinned BLS series. Episode-specific causal language and the quarterly alignment require final historical and data-manager review. Recession dating classifies chronology; it does not establish causation.
Questions
Question 1.10. A recession begins soon after interest rates rise. What can a timeline alone establish?
- The interest-rate increase caused the recession
- The recession caused the earlier interest-rate increase
- The rate increase preceded the downturn, which is a fact an explanation must address
- No useful statement can be made from chronology
Exercise
Chronology is not causation
Choose one recession episode named in this section. List two dated observations that a timeline could establish, one causal claim the timeline cannot establish, and one comparison or source that could help distinguish competing explanations.
The model solution is available in the restricted instructor materials.
1.7 Productivity, earnings, inequality, and government
Labor productivity measures how much output is produced per unit of labor input, often as output per hour worked. If output per hour rises, an economy can produce more without the same proportional increase in work hours. Technological change, skills, organization, infrastructure, and capital equipment can all contribute. But greater productive capacity does not determine how the gains are divided.
Figure 1.6 compares labor productivity with average real hourly compensation in the nonfarm business sector from 1973 through 2025. Compensation includes wages, salaries, and employer-paid benefits. Both series equal 100 in the first quarter of 1973 so we can compare their proportional changes, not their original units.
Reading Figure 1.5 one step at a time
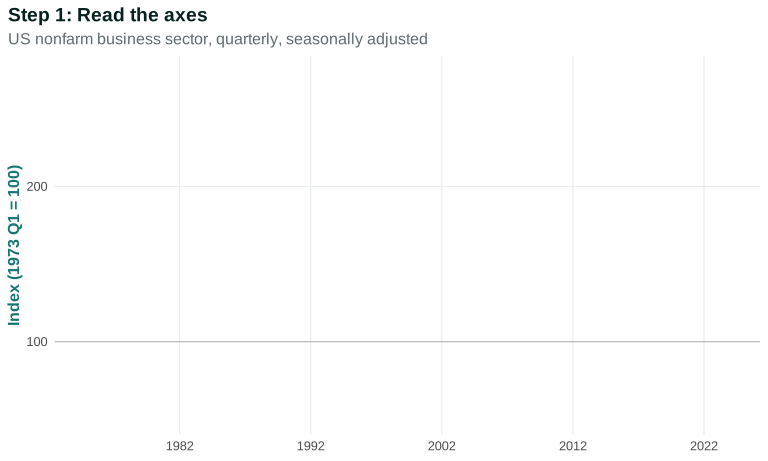
The horizontal axis shows time. The vertical axis is an index: both series will equal 100 in 1973 Q1. A value of 150 means the series is 50% above its value in the base quarter; it does not mean $150 or 150 units of output.
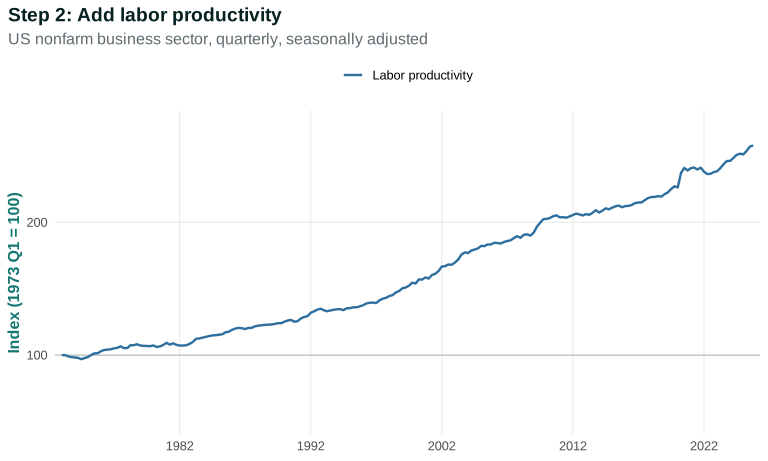
By 2025 Q4, the productivity index is about 258. Output per hour is therefore about 158 percent above its 1973 Q1 level. This is an index comparison, not a statement that output per hour equals 258 dollars.
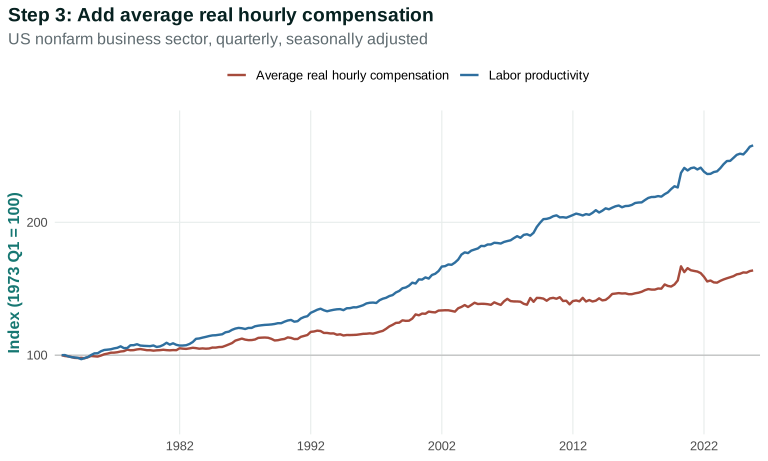
Average real hourly compensation also rises, reaching about 164 by 2025 Q4. The widening distance between the lines means that productivity grew more rapidly than this measure of average compensation over the period.
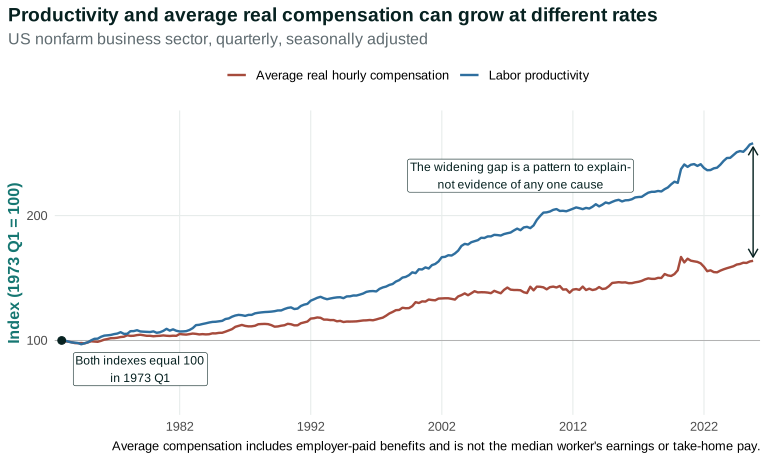
The annotations mark the shared base and the later gap. They make the comparison easier to read but do not identify its causes. Nor does an average tell us what happened to the worker at the midpoint of the earnings distribution.
Why use average compensation in the main figure? It covers the same broad sector and uses the same production-account framework as the productivity series, so the comparison is conceptually aligned. A median cash-earnings series answers a different and important question, but it covers a different population and excludes employer-paid benefits. Overlaying it without explanation would make an apparent like-for-like comparison that is not one.
| Measure | Population or sector | Pay concept | Benefits | Best use |
|---|---|---|---|---|
| Average real hourly compensation | Nonfarm business sector | Average real compensation per hour | Included | Compare compensation with output per hour |
| Median usual weekly earnings | Full-time wage and salary workers | Median real cash earnings per week | Excluded | Describe the midpoint full-time wage-and-salary worker |
The main figure therefore supports a precise claim: since 1973, labor productivity in the nonfarm business sector has increased substantially more than average real hourly compensation in that sector. It does not support the stronger claim that the line shows the pay of a “typical worker.” A later distributional comparison can use median earnings while making the change in population, pay concept, benefits, hours, and price adjustment explicit.
The gap is a puzzle, not a complete explanation. The two series use different price indexes suited to their purposes, and changing that choice changes the size of the gap. Changes in labor’s share of income also matter. So do institutions and power: bargaining, wage-setting practices, labor law, discrimination, corporate governance, taxation, social insurance, and ownership influence who can claim the gains from greater production. Chapters 2–4 develop those mechanisms.
The figure also has limits. It excludes government, farms, nonprofit institutions serving households, and private households. It shows averages within the nonfarm business sector. It does not reveal variation by race, gender, class, place, disability, citizenship, occupation, or firm. And because it is a pair of time series, it cannot establish which institutional or technological change caused the gap.
Government is not outside the economy. It purchases goods and services, employs workers, taxes and transfers income, provides infrastructure and education, regulates markets, and writes or enforces many of the rules that shape private choices. Later chapters analyze particular policies. Here, the drafting task is to make government visible without treating every change in a time series as the result of a single policy.
The rules of the game principle reminds us that statistics record outcomes generated under particular laws, institutions, and power relationships. Labor law, monetary arrangements, financial regulation, tax rules, social insurance, and the statistical definitions themselves influence what choices are feasible and how aggregate outcomes are measured.
Political participation is part of the dashboard
People also help choose—and contest—the institutions and policies that shape economic life. Figure 1.7 adds one bounded measure of political participation: reported voting in the November 2024 election among US citizens age 18 and older. This denominator excludes noncitizens because the table measures voting eligibility under current law; it is not a judgment about who is affected by policy or who belongs in an analysis of the economy.
Begin with the measure and denominator. Each point will show the percentage of a named citizen group that reported voting. Survey responses and administrative vote records are not identical measures, and turnout is only one form of political participation.
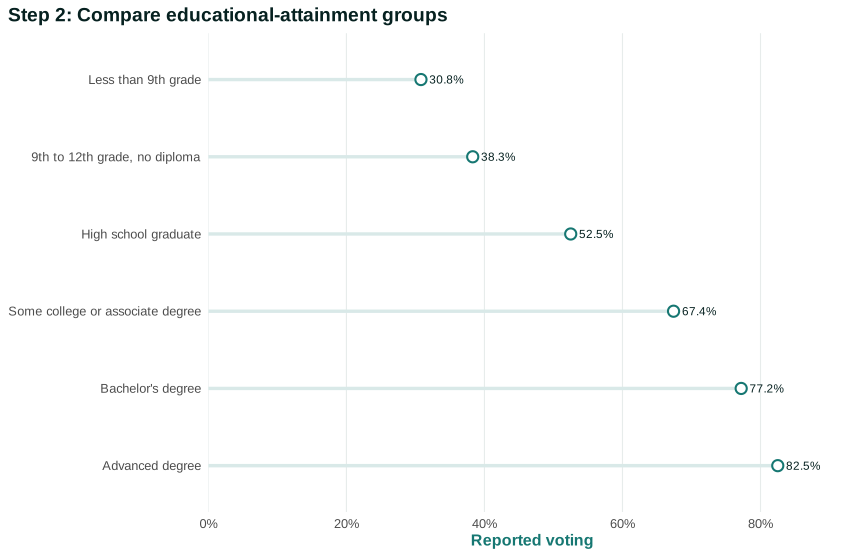
Reported voting rises across the broad educational-attainment groups. Compare named categories rather than saying simply that “education matters”: the difference is descriptive, and education can reflect credentials, age, income, wealth, institutional access, class position, and many other conditions.
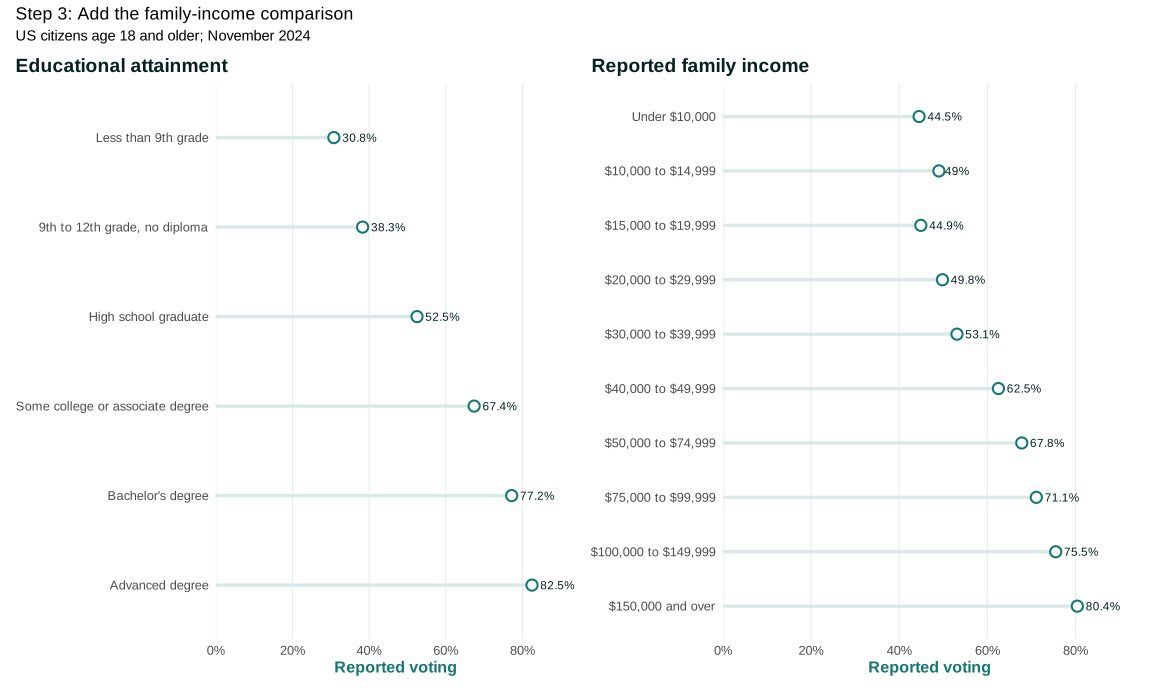
The family-income panel shows a broad upward gradient, with some small reversals among adjacent lower-income categories. The common scale lets us compare the size of differences without pretending that income is a complete measure of class or political resources.
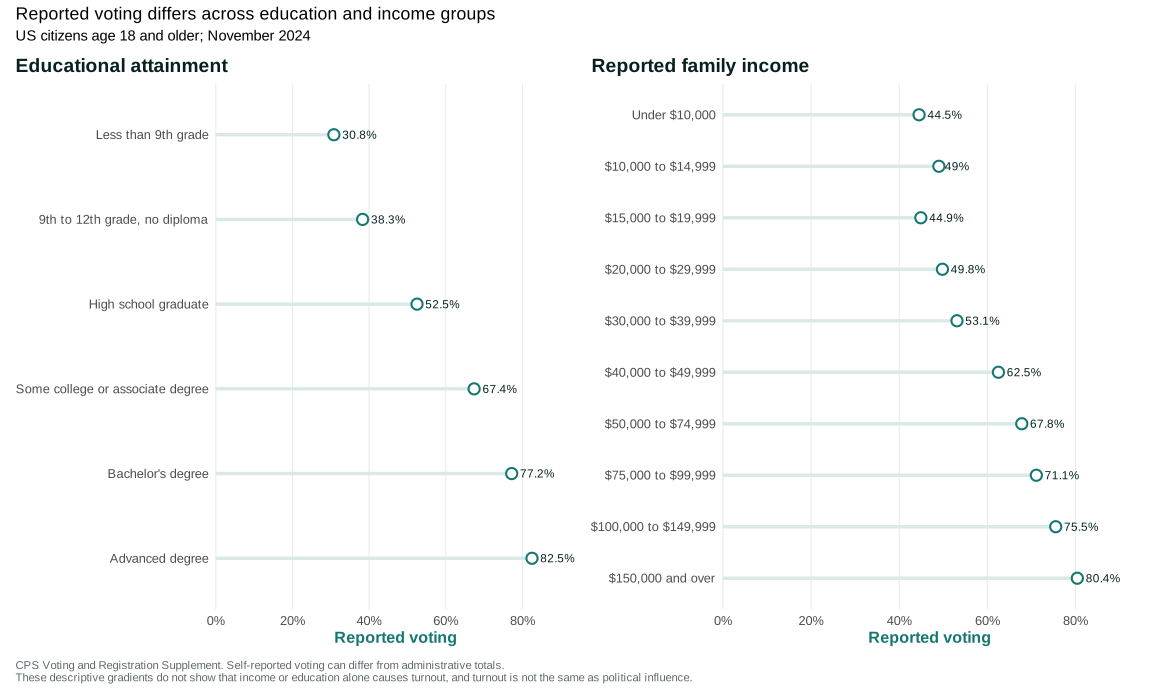
The pattern is a starting point for investigation, not a causal estimate. The chart does not show that additional schooling or income by itself causes a person to vote. Nor does voting frequency measure political influence, organizing, campaign finance, public authority, citizenship barriers, or the ability to shape which choices reach the ballot.
Draft data review flag. For Figure 1.6, verify the deflators, sector coverage, benefit treatment, rebasing date, endpoint values, and distinction between average compensation and median cash earnings. Source pages: OPHNFB and COMPRNFB. For Figure 1.7, verify the selected rows against Census Table 5 and Table 7, the citizen-population denominator, self-report limitation, accessibility text, and redistribution terms.
Questions
Review the live step-by-step figure
Question 1.11. Why does Figure 1.5 not by itself show what happened to a typical worker’s take-home pay?
- Labor productivity cannot be measured as output per hour
- Average real hourly compensation includes benefits and is not a median or disposable-income measure
- The two plotted series use exactly the same concept
- Index numbers cannot compare growth over time
Exercise
Average productivity and typical pay
Use Figure 1.5 to describe the two indexed series after 1973. Then explain why average real hourly compensation is not the same as a typical worker’s take-home pay and identify one alternative earnings measure you would want to inspect.
The model solution is available in the restricted instructor materials.
1.8 What the dashboard reveals—and what it hides
Return to the three entry moments—1950, 2009, and 2020. A macroeconomic dashboard helps place the choices people faced in context:
- real GDP per person locates the period within the long expansion of productive capacity;
- unemployment, participation, and employment indicate different dimensions of access to paid work;
- inflation distinguishes a changing price level from the pace at which prices are changing;
- productivity and compensation raise questions about how the gains from production are divided;
- reported voting adds one measure of participation in choosing the rules, while leaving political influence and other forms of collective action unmeasured; and
- recessions show that long-run growth contains disruptions whose costs are unevenly distributed.
The dashboard is a beginning, not a verdict. It reveals common movements and turning points. It hides differences among people and places, unpaid work, job quality, environmental damage, and many of the institutions that generate the numbers. Most importantly, it does not automatically turn a correlation into a cause.
Questions to carry into the book
- What determines employment, unemployment, real wages, and inflation?
- Why can spending decisions create economy-wide feedback?
- How do banks, financial markets, the Federal Reserve, and fiscal policy affect households and firms?
- Why do productivity and living standards grow, and why are their gains distributed unequally?
- How do rules, institutions, power, and collective choices change aggregate outcomes?
For every figure you encounter, practice a three-sentence discipline:
- Observation: What pattern does the figure show?
- Question: What mechanism might explain the pattern?
- Limit: What claim is not supported by this figure alone?
Draft source and reuse note. The definition of macroeconomic aggregation in the opening and the household-spending feedback example in Section 1.6 adapt The Economy 2.0: Macroeconomics, Section 1.9. The chapter uses US spelling and the UOE principles framework.
Questions
Question 1.12. Which is the strongest next step after observing that two macroeconomic series move together?
- State that one series caused the other
- Choose the explanation that best fits your prior belief
- Specify possible mechanisms and seek comparisons or evidence that distinguish them
- Remove observations in which the series do not move together
Exercise
Observation, mechanism, and limit
Choose one chapter figure. Write three short paragraphs: an accurate observation, two possible mechanisms that could generate it, and a limitation followed by one additional source or comparison you would examine.
The model solution is available in the restricted instructor materials.
Seeing the principles in action
| Principle | Example | Everyday Economics |
|---|---|---|
| Interdependence principle — focal | Workers’ search decisions and firms’ hiring decisions jointly determine employment and unemployment; neither side’s choices can be interpreted in isolation. | A local employer’s hiring freeze changes the options and expected search time facing many job seekers. |
| Doing the best you can principle | Workers decide whether and how to search given income needs, time, care obligations, transportation, information, and eligibility rules. | Two people who both want work may make different search choices because one has savings and reliable transportation while the other does not. |
| Rules of the game principle — focal | Statistical definitions determine who is classified as employed, unemployed, or outside the labor force; insurance and labor-market institutions also shape search. | A requirement to show active job search can affect both benefit eligibility and whether someone is counted as unemployed. |
| Trade-offs and opportunity costs principle | A person who keeps searching for a better job match forgoes current earnings and time, while accepting quickly may mean lower pay or poorer conditions. | Deciding whether to accept today’s offer or search for another week makes the opportunity cost of continued search visible. |
| Principle of gains from cooperation and conflict of interest | Workers and employers can both gain from successful job matches, while conflict over pay, schedules, and conditions can prevent or end a match. | A vacancy may be filled only if the offered wage and conditions make the job acceptable to the worker and hiring worthwhile to the employer. |
| Principle of individual and societal interests | Stopping search may be sensible for one person facing high costs and poor prospects, yet widespread withdrawal can leave productive capacity unused and make headline unemployment fall misleadingly. | A falling unemployment rate need not mean that everyone who wanted work found a job. |
| Principle of aggregation and feedback — focal | Individual labor-force classifications aggregate into national rates; a change in participation can move the unemployment rate without a change in employment. | If many discouraged workers stop searching, the headline unemployment rate can fall even though their situation has not improved. |
Skills and learning objectives
- Reading and interpreting an empirical graph (and its terms)
- Reading and comparing information in graphs with data
- Interpreting labor market statistics
- Computing a growth rate
- Defining important economic terms
- Understanding the difference between causality and correlation
- Understanding the strengths and limitations of using economic data
- Applying principles to a specific scenario
Concepts to learn
- Macroeconomics and aggregation
- Real gross domestic product and real GDP per capita
- Levels, changes, growth rates, percentages, and percentage points
- Data vintages and revisions
- Labor force, unemployment, labor force participation, and the employment-population ratio
- Price level, the Consumer Price Index, and inflation
- Nominal and real wages
- Recessions and recoveries
- Labor productivity and average real hourly compensation
- Correlation, causation, and evidence
Glossary
Chapter 1 terms
macroeconomics
Macroeconomics uses totals and averages such as aggregate output, employment, unemployment, and prices, while also studying feedback among households, firms, government, and other economies.
aggregation
Aggregation makes macroeconomic measurement possible but can conceal differences among groups and can introduce feedback that is not visible when one actor is considered alone.
real GDP per capita
Real GDP per capita measures the inflation-adjusted value of final goods and services produced within a country, divided by its population. It is an average of domestic production—not household income, a description of its distribution, or a complete measure of well-being.
See also: real gross domestic product.
real gross domestic product
Real gross domestic product measures domestic production after removing the effect of changes in the overall price level. It is a total for the economy; dividing it by the population produces real GDP per capita.
See also: real GDP per capita; price level.
labor force
People who are employed plus people who are unemployed and actively seeking work under the statistical definition.
See also: unemployment rate; labor force participation rate.
unemployment rate
The headline unemployment rate divides the number of unemployed people by the labor force, not by the full working-age population. Its interpretation therefore depends on employment, active search, and labor-force classifications.
See also: labor force; labor force participation rate; employment-population ratio.
labor force participation rate
The labor force as a percentage of the civilian noninstitutional population aged 16 and older.
See also: labor force; unemployment rate; employment-population ratio.
employment-population ratio
Employed people as a percentage of the civilian noninstitutional population aged 16 and older.
See also: unemployment rate; labor force participation rate.
price level
An index summarizing the prices of a representative basket of goods and services at a point in time.
See also: Consumer Price Index; inflation.
Consumer Price Index
A measure of the average change over time in prices paid by urban consumers for a representative basket of goods and services.
See also: price level; inflation.
inflation
An increase in the general price level, commonly expressed as the percentage change in a price index over a stated period.
See also: price level; Consumer Price Index; real wage.
real wage
A wage adjusted for the price level so that it reflects purchasing power.
See also: inflation; price level.
labor productivity
Output produced per unit of labor input, often measured as output per hour worked.
See also: real gross domestic product.
recession
US business-cycle dates are determined by the NBER using multiple indicators; a recession is not defined solely as two consecutive quarters of falling real GDP.
See also: real gross domestic product; unemployment rate.
data vintage
The version of a dataset available on a particular date, including any revisions known at that time.
percentage point
The arithmetic difference between two percentages; a rise from 4% to 5% is one percentage point.
purchasing power parity
Purchasing power parity, or PPP, adjusts international comparisons for differences in national price levels. It is useful for comparing material living standards, but results still depend on the basket, data, benchmark year, and statistical methods used.
See also: real GDP per capita.
life expectancy at birth
Life expectancy at birth summarizes age-specific mortality conditions in a particular period. It is not a forecast for one named child, and a national average can conceal large differences by class, race, gender, place, and access to health-supporting resources.
See also: real GDP per capita.
Flashcards
What does aggregation mean in macroeconomics?
Combining individual people, firms, goods, or transactions into an economy-wide total, rate, or average.
What seven items should you identify before interpreting a time-series graph?
Variable, population or denominator, units, frequency, adjustment, period or vintage, and source.
Why is real GDP per capita not the income of a typical household?
It is average inflation-adjusted domestic production per person; it does not show distribution and is not a direct household-income measure.
What is the denominator of the unemployment rate?
The labor force—the number of people classified as employed or unemployed.
Why can the unemployment rate fall without more people finding jobs?
Some unemployed people may stop actively searching and leave the labor force, reducing both unemployment and the labor-force denominator.
How does the employment-population ratio differ from the unemployment rate?
It divides employed people by the civilian noninstitutional population aged 16 and older instead of dividing unemployed people by the labor force.
If inflation falls from 8% to 3%, what happens to the price level?
The price level is still rising on average, but more slowly than before.
What is a real wage?
A wage adjusted for the price level so that it reflects purchasing power.
Why does a recession date not tell us the cause of a recession?
Dating identifies when broad activity contracted; causal explanation requires additional evidence and a mechanism.
What does labor productivity measure?
Output per unit of labor input, commonly output per hour worked.
Why is average real hourly compensation not the same as a typical worker’s take-home pay?
It is an average, includes employer-paid benefits, and covers a particular sector; it is neither a median nor disposable income.
What three sentences should accompany an initial reading of a figure?
State an observation, pose a mechanism question, and identify a claim the figure cannot support alone.