Long-Run Growth

Public working draft for review: Google Docs remains canonical. Simon Halliday authorized website publication for content and figure review on August 26, 2026. This AI-assisted feasibility draft is not an approved final chapter. The empirical hook, remaining figures, quantitative claims, provenance, rights, accessibility, and coauthor review remain incomplete or flagged.
Focal principles: Interdependence principle; Trade-offs and opportunity costs principle; Principle of individual and societal interests.
AI-assisted working draft — published for review, not approved as a final chapter. This draft was initialized with AI assistance from the approved chapter brief and named sources. Human authors and editors retain authority over wording and decisions. Preserve comments, suggestions, revision history, attribution, and accepted human edits. Simon Halliday provides final editorial and publication approval.
Draft basis and source hierarchy
The main theoretical spine comes from The Economy 2.0: Macroeconomics, Unit 9: measuring growth, ratio scales and compound change, production and productivity, capital accumulation, saving and investment, technology, coordination, institutions, and growth dynamics. US evidence and UOE pedagogy determine the teaching route. Microeconomic material appears only where a firm or household decision must be explained before aggregation.
Evidence status: BLS productivity, output, hours, and compensation series have been identified, but final vintages and checksums remain under review. The planned 2024 CPS median-pay snapshot is analytically separate from average hourly compensation. Illustrative numbers below teach mechanisms and are not estimates of current US magnitudes.
Learning objectives
By the end of the chapter, you should be able to distinguish total output, output per person, and output per hour; use compound growth to compare changes over long periods; explain how tools, infrastructure, skills, technology, organization, and institutions can raise productivity; distinguish an accounting decomposition from a causal explanation; trace saving and investment from one actor’s decision to economy-wide capacity; explain why productivity gains need not become typical pay gains; and identify why growth is not a complete measure of wellbeing or sustainability.
15.1 How much can one hour of work produce?
Picture a worker at the beginning and end of a long career. The task may look similar—moving goods through a warehouse, preparing a medical image, processing a payment, or fabricating a component—but the tools, software, energy system, training, work organization, and network of suppliers can be radically different. If an hour of work produces more valuable output, labor productivity has risen.
The opening BLS figure will compare an index of real nonfarm-business output with an index of hours worked and the resulting output-per-hour measure. An index shows proportional change from a reference period; it does not show dollars of output or a worker’s paycheck. Students should first read the axes, frequency, sector coverage, and reference value. Then they should ask which series grew faster and what arithmetic relationship connects them.
Labor productivity is real output divided by hours worked. That is an accounting relationship. It tells us how the measure is constructed, not why it changed. Productivity can rise because workers use more or better capital goods, because technology improves, because production is reorganized, because infrastructure reduces delay, because skills or health improve, or because low-productivity activities shrink relative to high-productivity activities. Measurement choices also matter.
Why care? Higher productivity can make more goods and services possible without requiring the same proportional increase in work time. It can support higher wages, profits, tax revenue, leisure, or public services. But “can” is not “will.” Who receives the gains depends on ownership, bargaining, competition, institutions, and policy. Growth therefore expands possibilities without deciding their distribution.
The chapter’s central question is: what makes an economy able to produce more over time, and what determines whether that greater capacity improves people’s lives broadly?
Source adaptation note
The opening comparison should teach three different ways output can rise. More people may work, each person may work more hours, or each hour may produce more. Total output combines all three. Output per person adjusts for population but still changes with employment and hours. Output per hour focuses more narrowly on production during measured work time. None of these measures is a direct index of happiness, effort, or fairness.
A numerical table can make the distinctions concrete. Economy A has 100 people, 50 workers, 2,000 annual hours per worker, and 100 units of output per worker. Economy B has the same population and employment but produces 120 units per worker with the same hours. Output per person and output per hour both rise. If instead Economy B achieves more output because each worker puts in many more hours, output per person rises while output per hour may not. The social meaning of the change differs.
Measurement also depends on what counts as output. A market service is generally included in GDP, while similar unpaid care inside a household is not. Quality improvement is difficult to separate from price change. Public services are often valued by their cost because no market price is observed. Nonfarm-business productivity excludes government, farms, households, and some nonprofit activity. The measure is useful precisely because it is defined; it becomes misleading when the definition is forgotten.
The hook can therefore ask two questions at once. How did measured productive capacity change, and what additional evidence is needed to know how people experienced the change? A productivity rise may support higher pay, shorter hours, lower prices, profits, or public revenue. It may coincide with job loss or intensified work. The chapter will explain the sources of capacity before examining who receives the gains.
When students read the final figure, they should narrate the accounting first: real output grew by one amount, hours by another, so output per hour followed their ratio. Only then should they propose mechanisms. A time series cannot by itself separate machines, technology, worker skills, reorganization, sector shifts, or measurement changes. Those are hypotheses the rest of the chapter investigates.
Source adaptation note
Questions
Question 15.1. What does an index of labor productivity measure?
- A worker’s hourly wage
- Real output per hour relative to a reference period
- Total household wealth
- The social value of every job
Exercise
Calculate output per hour
Output rises from an index of 100 to 125 while hours rise from 100 to 110. Calculate the implied output-per-hour index and explain why the calculation alone does not identify the cause.
The model solution is available in the restricted instructor materials.
15.2 Measuring growth over time
Economic growth usually refers to an increase in real output or real output per person. Nominal output can rise simply because prices rise, so long-run comparisons use measures adjusted for price change. Total real GDP answers a question about the economy’s scale. Real GDP per person adjusts for population. Neither is a complete measure of wellbeing.
Long time spans create a visual problem. A constant percentage increase produces larger absolute additions as the base grows. A ratio scale gives equal vertical distance to equal proportional change, making persistent growth rates easier to compare. Students should be able to read both linear and ratio scales and explain why they emphasize different patterns.
Compound growth means that each period’s increase builds on the previous level. If output per person rises by 2 percent from 100, it becomes 102 after one period. Another 2 percent applies to 102, not to the original 100. Over many years, a modest annual difference creates a large gap. The Rule of 70 offers a rough doubling-time calculation: divide 70 by the percentage growth rate. It is an approximation, not a law.
Growth rates can also mislead. A rebound after a deep decline may produce a high rate while the level remains below its earlier path. A fast-growing small sector may contribute little to total output. Average growth can hide recessions, regional decline, unpaid work, environmental damage, or unequal gains. A responsible comparison states the measure, period, population, price adjustment, and what is omitted.
Source adaptation note
Long-run comparisons require a price adjustment because the meaning of a dollar changes. A deflator is an index used to separate a nominal value into a real quantity measure under stated conventions. Different deflators cover different baskets and answer different questions. Real GDP uses a broad output price measure. Worker compensation may be adjusted by a consumer price index or an output deflator depending on whether the question concerns purchasing power or the division of output.
Per-person measures require another denominator. Population can grow because births exceed deaths or because people move. Output per person can rise while total output grows more slowly than in another economy with faster population growth. It can also fall during a recession even if long-run capacity remains. The numerator and denominator should always be named.
Compound growth creates path dependence in levels. Suppose two regions begin with different output-per-person levels but grow at the same percentage rate. The proportional gap remains, while the dollar gap widens. If the poorer region grows faster, it may catch up; whether that occurs and why belongs mainly to Chapter 16. Chapter 15 needs the arithmetic so that students can distinguish a level gap from a growth-rate difference.
Average annual growth can hide timing. Two decades can have the same compound annual growth rate even if one has smooth expansion and the other includes a collapse followed by recovery. Workers, firms, and governments experience those paths differently. Lost employment can scar earnings and investment. A single endpoint comparison is therefore insufficient for causal or welfare analysis.
A ratio scale helps identify proportional patterns, but it can make large absolute gaps look visually modest. A linear scale makes absolute differences salient but curves exponential growth upward. Neither is deceptive when labeled and taught. The appropriate display depends on whether the question concerns proportional rates or absolute resources. A Data Extension can show the same series on both scales and ask students to explain the changed visual impression.
The Rule of 70 should remain an approximation used for intuition. At 2 percent annual growth, a quantity doubles in roughly 35 years. That arithmetic does not forecast a constant rate or judge the desirability of doubling every output category. It simply shows why small persistent differences matter over long horizons.
Source adaptation note
Questions
Question 15.2. Why use a ratio scale for some long-run growth charts?
- It makes equal dollar changes equally spaced
- It makes equal proportional changes equally spaced
- It removes recessions from the series
- It converts output into wages
Exercise
Compare compound paths
Compare two economies beginning at the same output-per-person index. One grows at 1 percent annually and one at 2 percent. Calculate each index after ten years using compounding, then explain why this does not establish which society has greater wellbeing.
The model solution is available in the restricted instructor materials.
15.3 Tools, infrastructure, and productive capacity
Production combines labor with capital goods, energy, materials, knowledge, and organization. Capital goods are produced resources used to produce other goods and services: machines, buildings, software, vehicles, and networks. Public infrastructure—roads, transit, ports, water systems, schools, energy grids, and communications—can complement private capital and labor.
Begin with a table rather than a production-function graph. A small shop with two workers and one machine produces a stated amount. Adding a second appropriate machine may raise output because workers spend less time waiting. Adding a tenth machine to the same room may add little if labor, space, power, or demand is unchanged. The effect of one input depends on complementary inputs and organization.
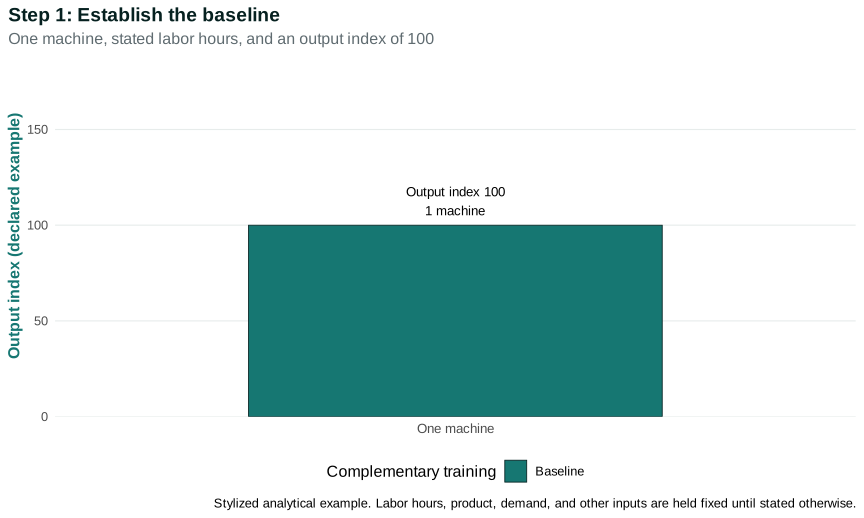
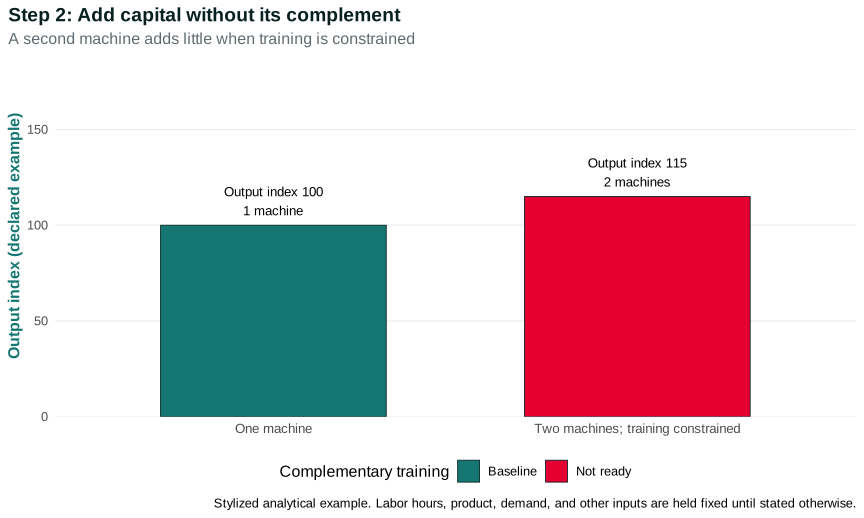
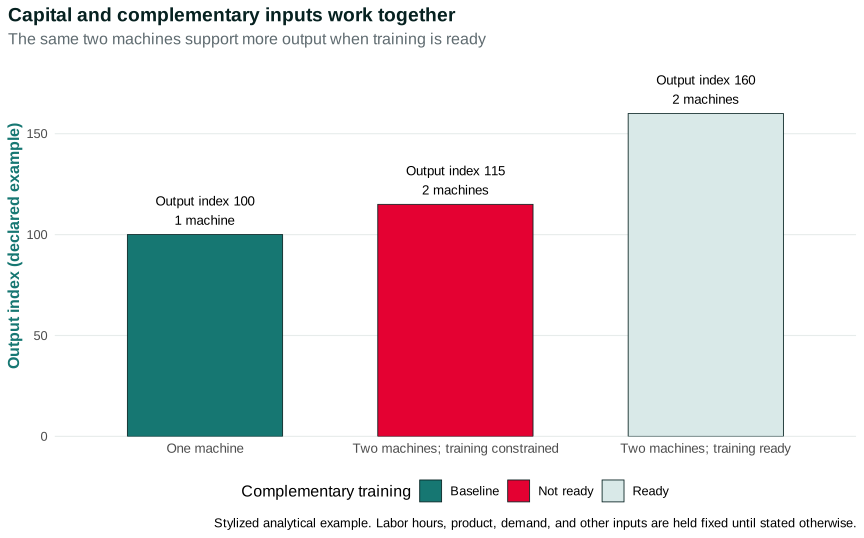
Investment adds to the capital stock; depreciation reduces it. If gross investment exceeds depreciation, the measured stock can rise. This accounting does not guarantee productivity. A poorly chosen machine, empty building, or incompatible software is still counted as investment. Productive capacity depends on fit, maintenance, energy, skills, suppliers, and demand.
Ownership changes the distributional question. A productivity-enhancing machine may make a worker’s task safer and support higher pay. It may also intensify monitoring, eliminate positions, or shift income toward owners. Workers may gain through wages, reduced effort, shorter hours, or public revenue—or may bear displacement risk. A growth mechanism must identify the actors who invest, the workers who adapt, the institutions that shape bargaining, and the people who bear transition costs.
Source adaptation note
Capital deepening means increasing capital goods relative to labor input. The phrase can sound mechanical, but every addition is a decision. A firm expects the machine or software to reduce cost, increase quality, expand capacity, or create a new product. It compares the expected benefit with the purchase price, financing cost, installation, training, maintenance, and risk that demand will be weak.
The effect on productivity depends on complementarity. A delivery company may buy electric vehicles, but productivity also depends on charging infrastructure, routing software, repair skills, electricity reliability, and delivery density. A hospital may install imaging equipment, but capacity depends on trained staff, scheduling, interpretation, and follow-up care. Capital cannot be analyzed separately from organization and public systems.
Depreciation is more than visible wear. Equipment can become obsolete when a better technology appears or when complementary systems change. Software may require continuing updates. Infrastructure deteriorates without maintenance. Gross investment records additions; net investment subtracts depreciation. A rising gross flow can coexist with a stagnant effective stock if replacement needs are large.
The production-function idea summarizes how inputs and technology relate to potential output. In the main text, use a table with named workplaces and changed conditions. Hold technology and organization fixed while one capital input changes; then explicitly relax the assumption. The formal curve can appear in an optional extension, where diminishing marginal product is presented as a property of the stated model, not a universal fact about every technology.
Capital accumulation can create a reinforcing sequence. Investment raises capacity; production provides revenue and learning; higher expected profit supports further investment. But the loop can stop if demand is weak, finance is unavailable, key infrastructure is missing, or owners prefer payouts and existing-asset purchases. The same observed investment rate can include projects with very different social value.
Workers bear adjustment risk. New capital may remove dangerous tasks or may make skills obsolete. Retraining takes time and may require income support, accessible education, transportation, and care. Employers may capture the gains if labor has weak outside options. Capital deepening explains a source of potential output; labor institutions and ownership help explain its distribution.
Source adaptation note
Questions
Review the live step-by-step figure
Question 15.3. Why might another machine add little output in a workplace?
- Capital goods cannot affect production
- Complementary labor, space, power, skills, or demand may be constrained
- Depreciation raises every machine’s capacity
- Every production process uses inputs in identical proportions
Exercise
Change one input
Design a four-row table in which a workplace adds capital while holding other conditions fixed, then relax one assumption. Identify worker, owner, and customer outcomes that output alone does not determine.
The model solution is available in the restricted instructor materials.
15.4 Technology, organization, and learning
Technology is knowledge about how to transform inputs into outputs. It includes scientific discoveries, production techniques, software, designs, and routines. Innovation creates or adapts knowledge; diffusion spreads it. An invention can exist for years before complementary investment and organizational change make it widely productive.
Firms invest in research, experiment with processes, train workers, and reorganize supply chains because they expect benefits. Yet private incentives do not automatically produce the socially most valuable innovation. Knowledge can spill over to other firms. Patents and secrecy can encourage investment while restricting diffusion. Dominant firms may buy or block rivals. Public research, universities, standards, procurement, and infrastructure can shape both direction and speed.
Learning by doing creates feedback. Producing more can generate experience; experience can lower cost or improve quality; improved productivity can expand demand and further production. Network effects and common standards can accelerate adoption. The same feedback can lock an economy into an inferior technology when switching requires coordinated action.
Organization matters because equipment does not operate itself. A new information system may fail if workers cannot report problems, if managers use it only for surveillance, or if tasks remain fragmented. Worker voice can improve implementation by revealing local knowledge. It can also conflict with an owner’s desire to retain control. Productivity is therefore social and institutional, not merely a property of a machine.
Source adaptation note
Innovation begins with a problem someone is trying to solve. A firm may seek lower cost or a more attractive product. A worker may devise a safer routine. A university laboratory may pursue knowledge without a near-term commercial use. A public agency may fund a technology needed for health, defense, energy, or infrastructure. These actors face different incentives and time horizons.
Knowledge has unusual economic properties. Using an idea does not necessarily prevent others from using it, and parts of the benefit can spill beyond the creator. That can lead to underinvestment when private investors cannot capture enough of the return. Intellectual-property rights can increase expected private return while raising prices or slowing follow-on use. Open standards and public research can support diffusion while requiring other financing. Institutional design trades off creation, access, and cumulative innovation.
Direction matters as well as rate. Research can be directed toward labor-saving surveillance, accessibility, clean energy, medical treatment, advertising, or military use. Market demand reflects purchasing power, not need alone. Public procurement and regulation can create markets and standards. Worker and community participation can reveal costs or benefits that an investor’s profit calculation omits.
Diffusion is often slower than invention because adoption requires complementary changes. Firms need finance, managers need information, workers need time to learn, and customers need confidence. Older equipment may still have useful life. A common standard may be unsettled. Early adopters generate information that later adopters use, creating a spillover. Credit constraints and market power can widen the gap between frontier and typical practice.
Organization determines whether a technology complements people. A warehouse system can reduce search time or intensify work through continuous monitoring. A medical record can coordinate care or burden clinicians with data entry. Productivity measures may record more transactions while missing stress, privacy, or quality. The mechanism must name which output improved and which costs moved outside the measure.
Learning by doing links production to future capacity. Repetition can reveal better techniques and lower unit cost. Workers and suppliers accumulate tacit knowledge that is difficult to buy instantly. Turnover, outsourcing, or short contracts can destroy that knowledge even when they lower measured current cost. Growth analysis should therefore include the institutions that retain, share, and reward learning.
Source adaptation note
Questions
Question 15.4. Why may invention fail to produce rapid productivity growth?
- Diffusion, complementary investment, skills, standards, or reorganization may be missing
- Knowledge cannot spread between organizations
- Firms face no coordination problems when adopting technology
- Technology and the capital stock are the same concept
Exercise
Trace technology adoption
Choose a technology used in health, transportation, education, or manufacturing. Trace invention, complementary investment, worker learning, organizational change, and diffusion. Identify one private incentive and one social spillover.
The model solution is available in the restricted instructor materials.
15.5 Saving, finance, and investment
Investment must be financed, but household saving and business investment are not the same decision. A household may save by holding a bank deposit, bond, retirement account, or equity claim. A firm invests when it purchases or creates productive assets. Financial institutions connect these balance sheets, assess projects, and allocate risk. Chapter 12 developed credit contracts; Chapter 13 develops the banking system. Here the question is how finance supports or blocks productive capacity.
National accounting links saving and investment at the aggregate level, with government and foreign balances included. The identity does not mean that a household’s additional saving automatically causes a firm to build a factory. Firms invest when expected demand and returns justify the commitment, financing is available, and complementary conditions exist. During a slump, widespread attempts to save by cutting consumption can reduce sales and investment.
Finance can widen the set of feasible investments by pooling resources and spreading risks. It can also direct credit toward collateral-rich existing assets rather than uncertain innovation, small firms, or underserved places. Wealthy owners can self-finance and wait; entrepreneurs without collateral may be constrained. The allocation of finance therefore affects which technologies and regions grow.
Public policy shapes this process through research funding, infrastructure, education and training, credit guarantees, development banks, taxation, regulation, and macroeconomic stabilization. Each instrument brings information and implementation problems. The relevant comparison asks which institution can identify projects, monitor performance, absorb risk, and share gains—not whether “markets” or “government” always invest better.
Source adaptation note
Follow a dollar of saving through three balance sheets. A household receives income and spends less than its disposable income, acquiring a financial asset. A financial institution receives funds or sells a claim and chooses assets. A firm obtains finance and purchases equipment. Only the final purchase of newly produced productive assets is business investment in the national accounts. The financial transactions arrange claims and risk along the way.
This sequence explains why saving is not a pile of resources waiting automatically for investment. The household chooses an asset based on liquidity and risk. The intermediary assesses expected return, collateral, regulation, and its own balance sheet. The firm invests based on demand, strategy, cost, and finance. If any link fails, intended saving may be held in liquid claims, finance existing assets, flow abroad, or accompany lower income.
Government and foreign sectors complete the accounting. A government deficit supplies net financial claims to other sectors under the accounting definitions. International borrowing and lending connect domestic investment with foreign saving. Chapter 14 develops those open-economy flows. The identity among sector balances constrains the totals but does not identify which actor caused a change or whether the financed activity is productive.
Expectations make investment volatile. A project that looks profitable under strong expected sales may be cancelled when firms anticipate a downturn. Lower investment reduces current demand and future capacity. Stabilization policy can support demand, while long-term public investment can provide complements. Yet an indiscriminate subsidy may finance projects that would have occurred anyway or reward politically connected firms.
Finance affects the direction of growth. Collateral-based lending can favor real estate and established firms. Venture finance may accept high failure rates while concentrating control and returns. Community lenders may possess local information but limited scale. Development banks and public guarantees can target infrastructure or innovation but require expertise, transparent mandates, and loss accountability. Each arrangement creates a principal–agent and risk-allocation problem.
The chapter should distinguish financing from real resources. Credit can mobilize workers, equipment, and materials, but it cannot create unlimited capacity without inflationary or supply constraints. At full use of key resources, additional nominal finance may mainly raise prices or redirect inputs. Investment policy therefore combines financial access with planning for skills, materials, energy, and implementation.
Source adaptation note
Questions
Question 15.5. What does the aggregate saving-investment identity establish?
- Each household dollar saved finances a particular productive project
- Accounting balances across sectors under stated definitions
- More intended saving necessarily raises current investment
- Financial institutions are irrelevant to investment
Exercise
Follow a saving flow
Trace three possible uses of an additional household deposit: a productive business loan, financing purchase of an existing asset, and a liquid reserve. Explain why the initial saving flow does not identify the final real investment.
The model solution is available in the restricted instructor materials.
15.6 Institutions, coordination, and growth paths
Growth depends on coordinated systems. A firm may not train workers if it expects them to leave; workers may not acquire specialized skills if firms do not invest; firms may not locate where infrastructure is weak; governments may not build infrastructure where the tax base is narrow. Each actor’s individually sensible choice can sustain a low-investment outcome.
Institutions change expectations and incentives. Property and contract rules can support investment, but the content and enforcement of rights matter. Competition can encourage innovation, while monopoly profits can finance research or suppress rivals. Labor institutions can support skills, voice, and income security or can be designed to exclude. Public administration can coordinate long projects, yet weak capacity, corruption, or political exclusion can redirect resources.
There is no single institutional checklist that guarantees growth. Institutions emerge from history and conflict, distribute authority, and interact with technology and world markets. A rule that supports investment for owners may transfer risk to workers or communities. A growth strategy can raise measured output while deepening regional, racial, gender, or class inequality.
The growth-dynamics model in TE 2.0 formalizes reinforcing links among investment, productivity, output, and future investment. The main text keeps the feedback verbal: expected demand and returns encourage investment; investment and learning can raise productivity; higher productivity can expand income and fiscal capacity; those resources can finance further investment. Weak demand, financing constraints, missing complements, or concentrated power can interrupt the loop.
Source adaptation note
Coordination failures can sustain several possible outcomes. In a low-investment outcome, firms expect few skilled workers and do not adopt advanced technology; workers expect few suitable jobs and do not invest in specialized training; infrastructure providers expect limited use and delay networks. No single actor can profitably move first. In a coordinated outcome, complementary commitments make each investment worthwhile.
Institutions can coordinate by setting standards, providing credible long-term demand, sharing information, financing common infrastructure, or distributing transition risk. An industry training partnership can align curricula with jobs. Public procurement can guarantee early demand. A grid plan can coordinate energy investment. A collective-bargaining agreement can support training and worker cooperation. Each solution depends on trust, enforcement, and who has authority.
Institutions also distribute power. Property rights protect control over assets, but the definition of property determines which claims are recognized. Corporate governance allocates authority among owners, boards, managers, workers, and creditors. Labor law shapes bargaining and voice. Bankruptcy reallocates losses after failure. Competition policy affects whether successful firms can block entry or acquire rivals. These rules influence innovation and investment through concrete mechanisms.
Institutional quality should not be reduced to one cross-country score. A measure may reflect investor perceptions, formal rules, outcomes, or ideology. Institutions work differently across sectors and groups. A state can have strong capacity for taxation or policing and weak capacity for public health or infrastructure. A rule can be predictable for powerful firms and inaccessible to workers or small businesses. Chapter 16 will compare development paths with this caution.
The growth-dynamics feedback is conditional. Higher productivity may increase profit and wages; stronger demand and fiscal revenue may finance more investment; experience may improve technology. But gains can be extracted rather than reinvested, demand can leak toward imports, or monopoly can reduce pressure to innovate. Higher productivity can displace workers and weaken demand if income shifts toward groups with lower spending propensities. The direction of feedback must be explained, not assumed.
Historical path matters because early investments create capabilities and constituencies. A transport network shapes settlement and industry. An education system shapes skills and credentials. Fossil-fuel infrastructure creates jobs, assets, and political power that influence later energy choices. Path dependence does not mean change is impossible; it means switching costs and distributional conflict are part of the mechanism.
Source adaptation note
Questions
Question 15.6. What is a coordination problem?
- Complementary choices fail to occur even though a coordinated change could benefit the actors
- A mismatch in an accounting table
- Evidence that any government intervention will succeed
- A synonym for low individual effort
Exercise
Build a coordination loop
Construct a coordination loop involving firms, workers, and a public infrastructure agency. Give one institution that might change expectations and one implementation risk it creates.
The model solution is available in the restricted instructor materials.
15.7 Productivity, pay, and the distribution of gains
If output per hour rises, more income is available per hour in the measured sector. That does not determine the division among wages, benefits, profits, taxes, and other claims. Compensation depends on labor-market institutions, bargaining power, unemployment, occupational composition, competition, ownership, and price measures.
The planned figure will compare BLS productivity with average real compensation using compatible concepts and will present the 2024 CPS median usual weekly earnings as a separate snapshot. Average compensation is not typical pay. Weekly earnings combine hourly pay and hours. Different deflators answer different purchasing-power questions. An honest display states these differences instead of forcing unlike series onto one line.
Technology can change labor demand in opposing directions. It can replace tasks, create new tasks, lower prices and expand demand, or complement particular skills. The outcome depends on product demand, the pace of adjustment, training access, mobility, bargaining, and ownership. Workers displaced now are not compensated merely because aggregate output may be higher later.
Class shapes how gains and risks are experienced. Owners receive returns and capital gains; managers exercise authority; workers depend on wages and face job-loss risk; households differ in wealth, credentials, care responsibilities, disability, citizenship, and ability to move. Race, gender, and place affect occupation, wealth, exposure, and institutional treatment. These are intersecting mechanisms, not rival labels.
Source adaptation note
Begin the distribution analysis with an income-accounting table. Output creates labor compensation, profits and other property income, taxes net of subsidies, and depreciation under the chosen accounting frame. Productivity growth increases output per hour, but the shares and price adjustments determine how the increase appears to workers and owners. A stable labor share can still hide unequal changes across occupations and percentiles.
Average compensation includes employer-paid benefits as well as wages and reflects the mean across covered workers. Median weekly earnings identify the middle worker in a different population and combine pay with usual hours. A consumer deflator asks what compensation can buy; an output deflator connects compensation with product prices. These choices should be shown as a comparison table before any claim about a gap.
Bargaining provides one mechanism. When unemployment is low and workers can leave for alternatives, employers may need to share productivity gains to retain and recruit. Unions can coordinate bargaining and voice. Minimum wages, labor standards, occupational licensing, immigration rules, and noncompete agreements affect outside options and authority. Product-market power can raise profits without a parallel productivity increase.
Technology changes tasks rather than replacing whole occupations in a uniform way. Some tasks are automated, some are complemented, and new tasks appear. Workers within the same occupation can experience different effects depending on workplace organization. Education and training may help, but they do not guarantee that enough suitable jobs exist or that workers capture the returns. Treating the outcome as a race between skills and technology would omit institutions and demand.
Place matters because adjustment is costly. A productivity shift can expand one region while reducing employment in another. Moving requires housing, money, social networks, disability access, and care arrangements. Local tax bases and public services can weaken after job loss, reinforcing divergence. Aggregate gains do not compensate a displaced community unless an institution actually transfers resources or creates alternatives.
Ownership matters because capital gains and profits accrue to asset holders. Retirement accounts broaden ownership but remain unequally distributed and do not give most workers managerial authority. Workers may be both wage earners and indirect asset owners, yet their exposure and control differ from those of concentrated owners. A class analysis should identify these mixed positions without collapsing them into income categories.
Source adaptation note
Questions
Question 15.7. Why can productivity grow faster than median weekly earnings?
- Productivity equals each worker’s pay by definition
- Distribution, hours, coverage, price indexes, and composition can differ
- Median and average earnings are interchangeable
- Profit income cannot change when productivity changes
Exercise
Compare unlike measures carefully
Write a source note that lets a reader compare a productivity index, average compensation index, and median weekly earnings without implying that the three have identical populations or units.
The model solution is available in the restricted instructor materials.
15.8 Growth as possibility, not guarantee
Real output per person is useful because material resources matter. It is incomplete because unpaid care, household production, leisure, health, security, environmental depletion, and distribution are not fully captured. Quality change and digital services are difficult to measure. A higher average can coexist with falling resources for part of the population.
Growth can expand options. It can also intensify resource use and emissions depending on technology, energy, consumption, and policy. Chapter 16 compares countries, catch-up and divergence, structural transformation, colonial and global relationships, and competing claims about sustainable growth. This chapter establishes the growth mechanism without deciding whether every kind of output should grow or whether historical growth paths are ecologically feasible.
The central lesson is conditional. Investment, technology, organization, skills, infrastructure, and institutions can raise productive capacity. Reinforcing feedback can sustain growth, while missing complements and conflict can block it. Greater capacity creates potential gains. Ownership, bargaining, public choices, and ecological constraints determine who gains, who bears transition risk, and whether the result improves life.
The final evaluation should separate capacity, use, and outcome. Productivity measures capacity within a defined production boundary. Output records what was produced and valued under national-account conventions. Wellbeing depends on consumption, services, health, security, leisure, relationships, rights, distribution, and environmental conditions. Growth can improve these outcomes by expanding resources, but the link is institutional and causal rather than definitional.
Unpaid care shows the boundary problem. If care moves from a household into a paid service, measured GDP rises even if the amount and quality of care are unchanged. If a cleaner environment improves health without a market transaction, the benefit may be missed. If pollution raises medical spending, GDP can rise while wellbeing falls. These examples do not make GDP useless; they identify the question it answers.
Risk should be included in growth evaluation. A production system may deliver high average output while exposing workers to volatile hours, households to debt, or communities to disaster. Insurance and public services can convert capacity into security. Conversely, rapid investment financed by fragile debt can raise output temporarily and create later losses. Chapter 13’s financial instability and Chapter 16’s ecological constraints connect directly to the quality of a growth path.
Distribution affects sustainability and political durability. If gains are concentrated while transition costs fall on particular workers or regions, support for investment and policy can weaken. Compensation in principle is not compensation in practice. A credible transition identifies funding, eligibility, timing, administrative capacity, and voice. These questions prepare students for government tools in Chapter 17 and political selection in Chapter 18.
The bridge to Chapter 16 should state what remains unresolved. Chapter 15 has explained how productivity, capital, technology, organization, skills, finance, coordination, and institutions can produce long-run growth. It has not explained why some countries catch up while others diverge, how colonial and global relationships shape capabilities, or whether output growth can be separated sufficiently from material throughput and emissions. Those require comparative evidence and explicit biophysical accounting.
Students should finish with a disciplined claim: economic growth is a change in measured productive output, usually considered in real and per-person terms. It can expand the feasible set of private and public choices. It does not choose among those choices, distribute the gains, guarantee security, or settle environmental feasibility. Those are economic questions too.
The conclusion can test this discipline with three scenarios. In the first, output per hour rises because a safer technology reduces downtime and injury while pay and leisure also rise. In the second, output per hour rises because measured transactions accelerate, but monitoring intensifies and unpaid preparation grows. In the third, real output per person rises while pollution and regional inequality worsen. The same headline growth measure accompanies different mechanisms and outcomes. Students should identify what additional evidence changes the evaluation.
The first scenario illustrates a potential productivity dividend. Greater capacity can be divided among more output, higher compensation, lower prices, shorter hours, safer work, or higher public revenue. These uses may reinforce one another: lower cost can expand demand, higher wages can support spending, and public revenue can finance infrastructure. They can also conflict if owners, workers, consumers, and governments make incompatible claims on the gain. Institutions determine the adjustment.
The second scenario reveals measurement and boundary problems. If unpaid work shifts outside the measured workplace, recorded productivity may rise without a proportional reduction in total labor. If quality falls while quantity rises, the output measure may overstate improvement. Conversely, a service can improve in quality without a well-measured quantity increase. Sector-specific evidence is needed before interpreting an aggregate productivity change as a workplace experience.
The third scenario connects growth to distribution and biophysical limits. A national average can rise while a region loses its economic base. Cleaner production in one place can coexist with imported material and emissions elsewhere. Declining emissions intensity means less pollution per dollar of output; absolute decoupling requires total harmful emissions to fall while output rises. Chapter 16 evaluates those empirical distinctions and the international distribution of production and responsibility.
Public choices influence which scenario is more likely. Research funding shapes technological direction. Labor standards and bargaining affect whether gains become pay, safety, or time. Competition policy affects diffusion and rents. Infrastructure and social insurance affect who can adapt. Environmental rules affect which costs are included in decisions. These policies do not operate on a blank economy; they interact with ownership, existing capital, and political power.
Growth policy therefore requires a portfolio rather than one lever. Investment incentives without demand may fail. Training without jobs may disappoint. Infrastructure without maintenance can deteriorate. Innovation support without diffusion can concentrate gains. Redistribution after the fact may not restore lost authority, community, or health. A mechanism-based approach asks which constraint binds and how the proposed instrument changes behavior and risk.
The chapter should end with a forward-looking but non-prescriptive question: if economies can follow different growth paths, what makes some countries acquire and spread productive capabilities faster, and can those paths meet material needs within ecological limits? That question belongs to Chapter 16. Students carry forward the measurement tools, compound arithmetic, input complementarities, institutional feedback, and distributional questions developed here.
To consolidate the theory, students can build a growth-mechanism map with five linked boxes: resources and capabilities, investment, productivity, income and demand, and future investment. Every arrow must contain a named actor and behavior. “Investment raises productivity” becomes “a firm installs a compatible technology, workers learn to use it, and effective output per hour rises.” “Income raises investment” becomes “stronger expected sales and available finance make additional capacity profitable.” The map makes assumptions visible.
Students should then break one arrow. If credit is unavailable, profitable projects may remain unfunded. If expected demand is weak, a low interest rate may not induce investment. If workers are excluded from training, equipment may be underused. If monopoly allows owners to collect rents without innovating, profit need not finance productivity. If public infrastructure fails, private projects may be individually unviable. These failures show why a growth rate cannot be explained by naming inputs alone.
A second changed condition should address distribution. Suppose productivity rises but worker bargaining power falls. More output is available per hour, yet compensation may not keep pace and labor’s share can decline. Consumption demand may weaken if gains flow toward actors who spend a smaller fraction. Owners may invest the gain, purchase existing assets, or distribute it. The aggregate feedback depends on those choices. Distribution is part of growth dynamics, not only an ethical assessment after growth occurs.
A third changed condition should address public capacity. A government may finance research and infrastructure, coordinate standards, insure workers during transition, or enforce competition. Each tool requires revenue, expertise, and political durability. A successful public investment can crowd in private activity by creating complements. A poorly selected or administered project can waste scarce resources. The correct comparison is among feasible institutional designs and their evidence.
The final review should ask students to classify claims. “Output per hour equals real output divided by hours” is an accounting relationship. “Firms invest more when expected demand rises” is behavioral. “A particular subsidy caused adoption” is causal and requires a design. “Higher investment raises income, which encourages further investment” is an aggregation feedback. This classification keeps equations, evidence, and mechanisms in their proper roles.
The chapter’s contribution is therefore not a list of growth ingredients. It is a way to reason from actors and constraints to economy-wide change. Tools, knowledge, skills, infrastructure, finance, organization, and institutions work through complementary choices. Their gains and risks are distributed through ownership and authority. Productive capacity is historically created, maintained, and redirected rather than arriving as an unexplained trend.
For intermediate preparation, a closed Math Extension may introduce a production function and growth-accounting notation after the verbal sequence is secure. It should explain that the estimated contribution assigned to productivity is a residual conditional on the model, input measures, factor shares, and aggregation assumptions. The residual is not a direct observation of innovation, effort, or institutional quality. Students should be able to translate every term back into a measured quantity and state what remains unexplained.
The extension can also distinguish diminishing returns to one input from returns to scale when all inputs change. These are separate model properties. Main-text conclusions should not depend on students mastering the algebra. The purpose is to prepare interested students for later courses while preserving the chapter’s central empirical caution: a decomposition organizes measured growth but does not by itself identify causal mechanisms.
Source adaptation note
Questions
Question 15.8. Which conclusion follows from higher real GDP per person?
- Every person’s wellbeing increased
- Measured productive resources per person rose, but distribution and omitted outcomes still require evidence
- Environmental damage necessarily fell
- Unpaid work was fully included
Exercise
Design a growth dashboard
Design a five-indicator dashboard for evaluating a decade of growth. Include productive capacity, distribution, labor time or security, health or public services, and an environmental measure. Explain why no single indicator can replace the others.
The model solution is available in the restricted instructor materials.
Seeing the principles in action
| Principle | Example | Everyday Economics |
|---|---|---|
| Interdependence principle — focal | Productivity depends on complementary workers, capital, infrastructure, knowledge, finance, organizations, and public institutions. | A new machine may add little output until workers are trained and the production process is reorganized. |
| Doing the best you can principle | Firms and households compare investment, adoption, saving, and consumption choices under uncertain returns and financing constraints. | A firm may delay a valuable technology when demand or credit is too uncertain. |
| Rules of the game principle | Property, competition, education, finance, labor, infrastructure, and research institutions shape innovation and diffusion. | A common technical standard can make complementary investments more attractive. |
| Trade-offs and opportunity costs principle — focal | Investment uses labor and resources now to expand later capacity, while depreciation and uncertainty can reduce the gain. | Building equipment today can mean less current consumption or another forgone project. |
| Principle of gains from cooperation and conflict of interest | Knowledge, standards, infrastructure, and coordinated investment can generate gains while owners, workers, and communities conflict over their distribution. | A productivity improvement can enlarge output without fixing how wages, profits, or prices change. |
| Principle of individual and societal interests — focal | A profitable private investment may omit spillovers, worker displacement, unpaid work, public costs, or environmental damage. | A labor-saving technology can benefit customers while concentrating adjustment costs on particular workers and places. |
| Principle of aggregation and feedback | Investment, demand, learning, productivity, income, and expectations can form reinforcing or weakening long-run feedback loops. | Firms may all postpone investment when weak expected sales make each project look less attractive. |
Skills and concepts
Skills and learning objectives
- Reading output hours and productivity indexes
- Calculating compound growth and distinguishing levels from rates
- Decomposing output per person as an accounting identity
- Explaining capital deepening and complementary inputs
- Tracing invention adoption learning and diffusion
- Distinguishing saving finance and real investment
- Evaluating institutions and coordination in growth paths
- Assessing growth using distributional and wellbeing evidence
Concepts to learn
- Labor productivity
- Productivity index
- Growth rate
- Compound growth
- Ratio scale
- Capital deepening
- Depreciation
- Innovation
- Diffusion
- Investment
- Coordination problem
- Production function
- Real GDP per person
Data literacy
For each planned BLS series, state the population, sector, frequency, seasonal adjustment, index reference, deflator, and vintage. Explain why output per hour is an accounting ratio and why a movement alongside pay does not by itself identify bargaining, technology, or policy as the cause.
Review flags
Quantitative review is required before inserting current BLS or CPS values. Growth-accounting language requires coauthor review so that a residual is not presented as a direct measure of technology. Chapter 16 owns international convergence and ecological constraints. Figure production remains in R from pinned data. This feasibility draft does not authorize publication or Quarto synchronization.
Glossary
Chapter 15 terms
labor productivity
Real output produced per unit of labor input, commonly measured per hour for an aggregate sector rather than as one worker’s physical output.
See also: productivity index; real GDP per person.
productivity index
A measure that expresses productivity relative to a reference period set to a value such as 100; it shows proportional change rather than dollars or physical units.
See also: labor productivity; growth rate.
growth rate
The percentage change in a measure between periods; the same rate produces a larger absolute change when applied to a larger starting level.
See also: compound growth; ratio scale.
compound growth
Growth in which each period’s percentage change applies to the level produced by earlier changes, allowing small rate differences to create large long-run gaps.
See also: growth rate; ratio scale.
ratio scale
A logarithmic chart scale on which equal proportional changes occupy equal vertical distances, helping compare growth rates across different starting levels.
See also: growth rate; compound growth.
capital deepening
An increase in capital goods available per worker or labor hour, whose productive effect depends on complementary inputs and organization.
See also: depreciation; investment.
depreciation
The decline in productive capital through wear, damage, obsolescence, or retirement; gross investment must exceed it for the measured capital stock to rise.
See also: capital deepening; investment.
innovation
The development or practical use of a new or improved product, process, organization, or method; invention alone does not guarantee widespread adoption.
See also: diffusion; capital deepening.
diffusion
The spread and adoption of a technology or practice across firms, workers, organizations, and places, often requiring complementary investment and learning.
See also: innovation; capital deepening.
investment
Expenditure on newly produced capital goods, structures, inventories, or intellectual property under stated national-accounting definitions, not every purchase called an investment in everyday speech.
See also: capital deepening; depreciation.
real GDP per person
Inflation-adjusted gross domestic product divided by population; it measures average recorded production per person but not its distribution or all dimensions of wellbeing.
See also: labor productivity; growth rate.
Flashcards
What does labor productivity measure?
Real output per unit of labor input, commonly output per hour for an aggregate sector.
Why do small growth-rate differences matter over long periods?
Compounding applies each percentage change to the level produced by earlier changes, so gaps accumulate.
Why is invention not the same as diffusion?
Invention creates a new idea or method; diffusion requires adoption, complementary investment, learning, and organizational change across users.
Why does productivity growth not determine median pay growth?
Coverage, hours, price indexes, bargaining, ownership, profits, and the earnings distribution can all differ.